微信公众号 RStata

丰富的案例
经过长达 3 年的积累,RStata 社区已经积累了丰富的数据处理和绘图案例。
生动的视频讲解
过去三年里,RStata 社区里更新了超过 500 小时的视频课程,你需要的各种数据处理方法、绘图技巧,均有类似课程可以学习。
7x12h 的提问解答
在学习过程中如果遇到了问题,可以及时向我们的答疑老师进行提问,我们会尽可能及时的解答。
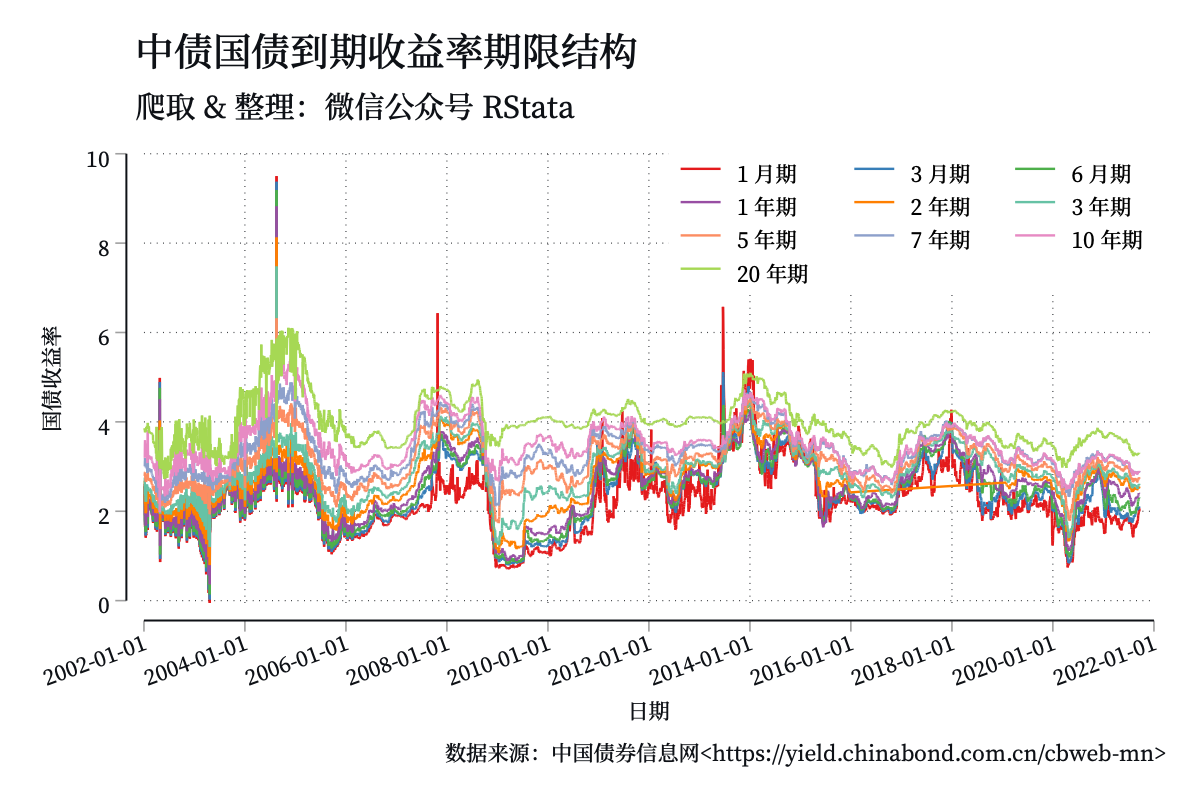
尽可能准确的数据资料
没有十全十美的数据,但是我们尽力为大家整理一手、尽可能准确的数据资料。提供的各种数据资料处理方法透明、来源清晰,是用于实证研究的最佳数据来源之一。
- library(tidyverse)
- library(ggplot2)
- clear all
- sysuse auto, clear