电脑里面收藏夹里面收藏了很多网页,但是经常懒得翻看,而且难以检索,所以整理下都放到这里。
数据
- 清代糧價資料庫
- The 30 m annual land cover datasets and its dynamics in China from 1990 to 2020
- ChinaHighPM10: Big Data Seamless 1 km Ground-level PM10 Dataset for China
- ChinaHighNO2: Big Data Seamless 1 km Ground-level NO2 Dataset for China
- Full-coverage 1 km daily ambient PM2.5 and O3 concentrations of China in 2005-2017 based on multi-variable random forest model
- ChinaHighPM2.5: Big Data Seamless 1 km Ground-level PM2.5 Dataset for China
- 中国地震台网
- 中国历代人物传记资料库
- An extended time series (2000–2018) of global NPP-VIIRS-like nighttime light data from a cross-sensor calibration
- 资源检索 - 中国工程科技知识中心
- 排污许可证企业信息数据集(2017-2021)
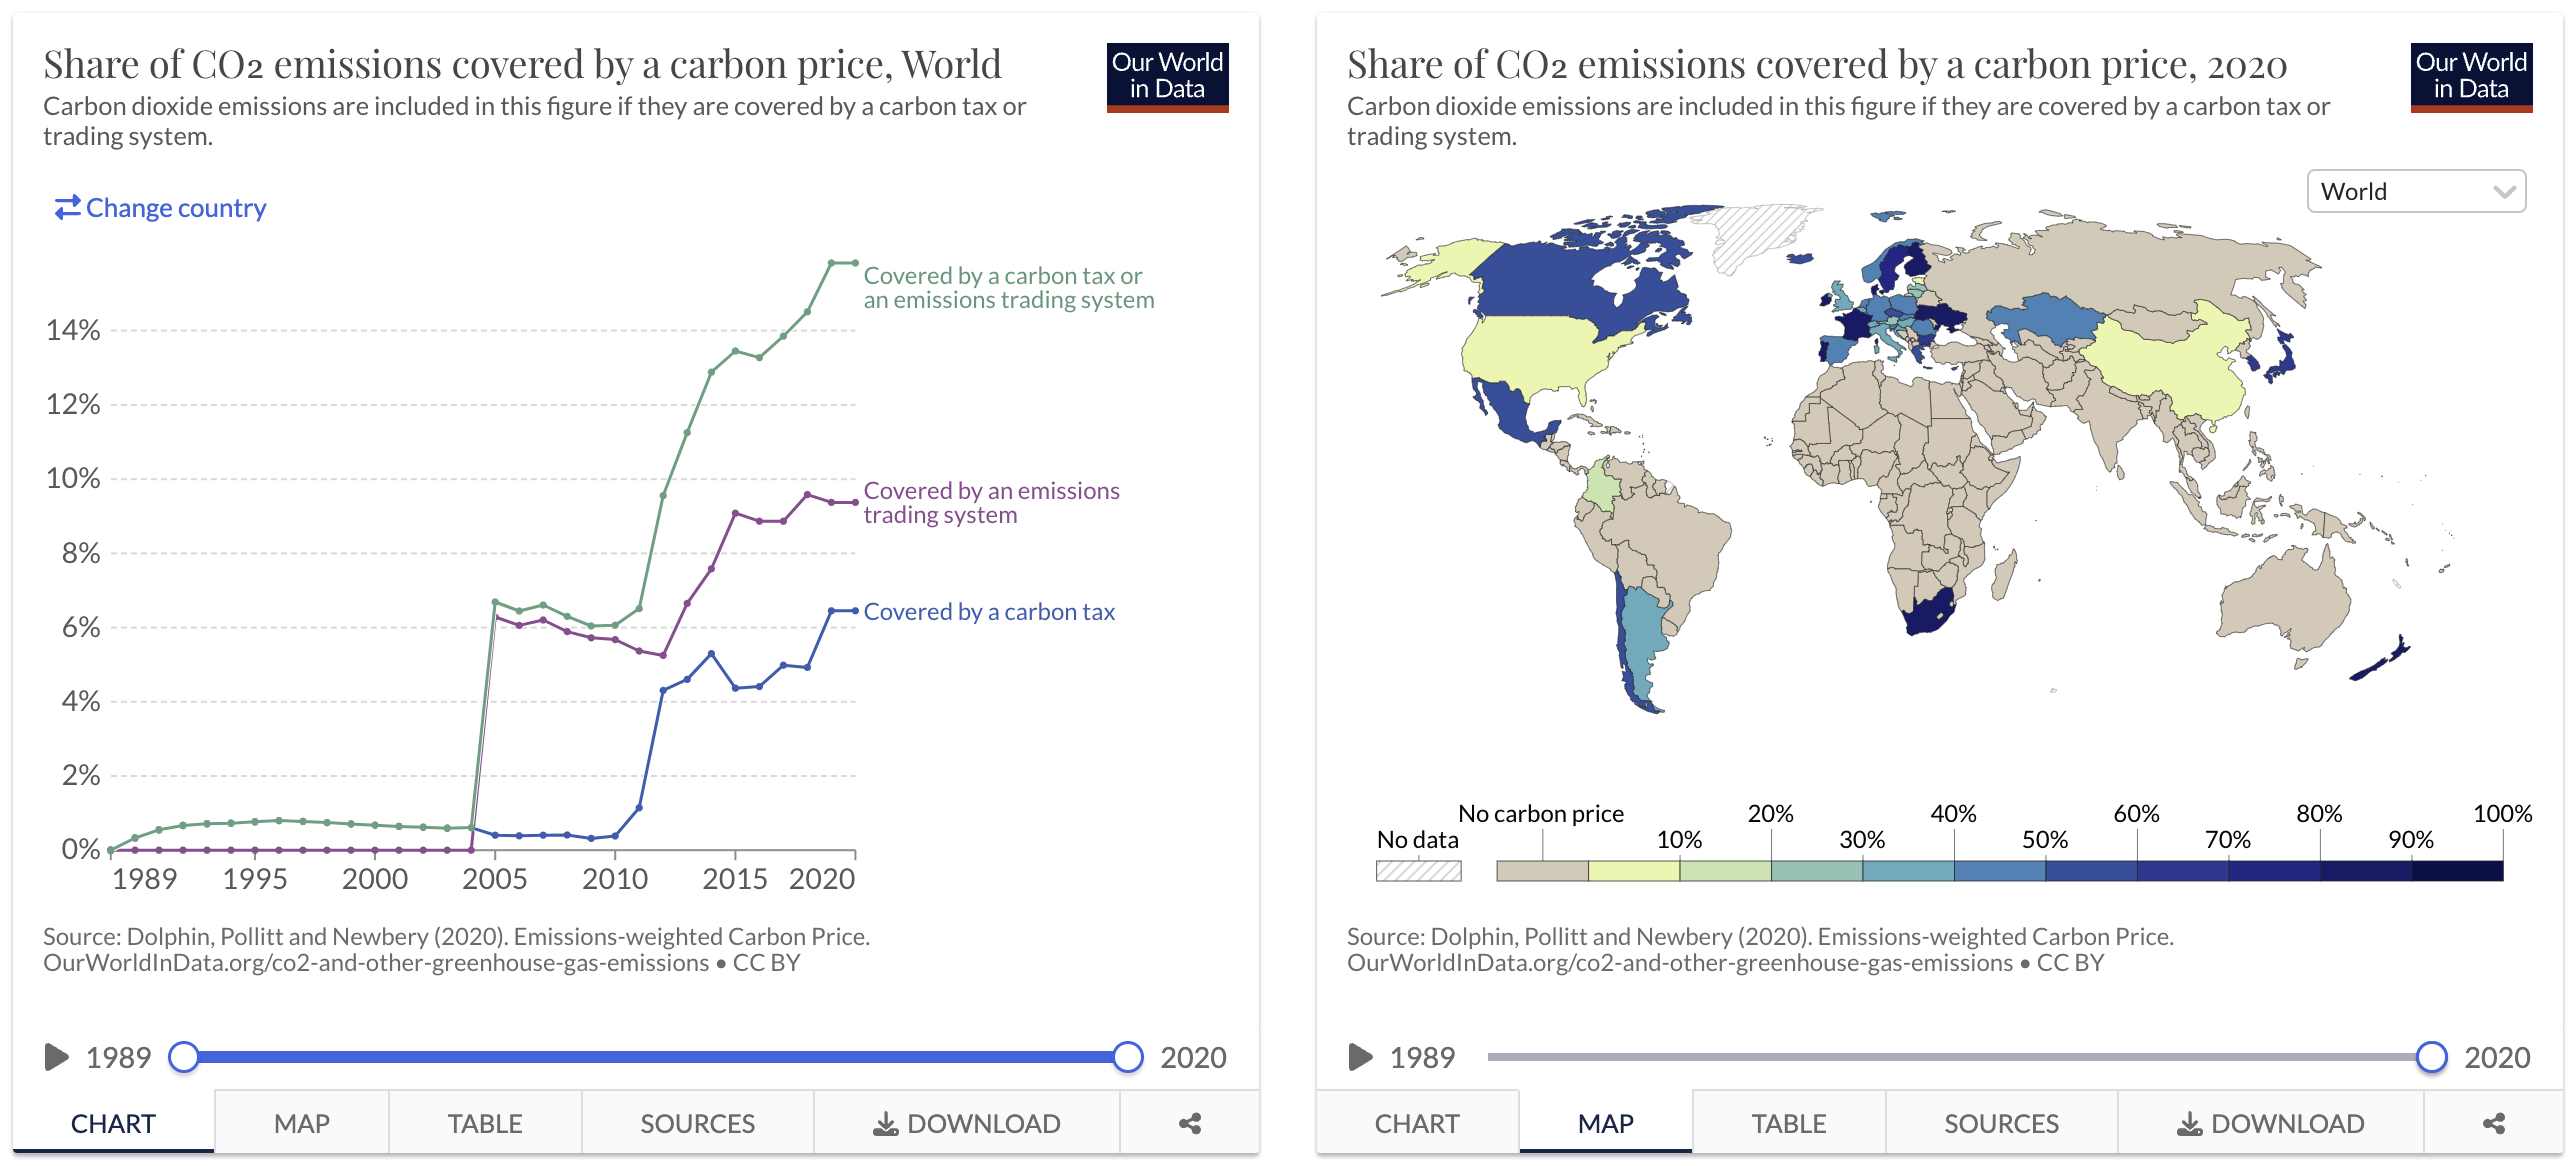
- Which countries have put a price on carbon?
- Natural Earth » 1:10m Cultural Vectors - Free vector and raster map data at 1:10m, 1:50m, and 1:110m scales
- COVID-19 全球数据
- COVID-19 deaths and cases: how do sources compare?
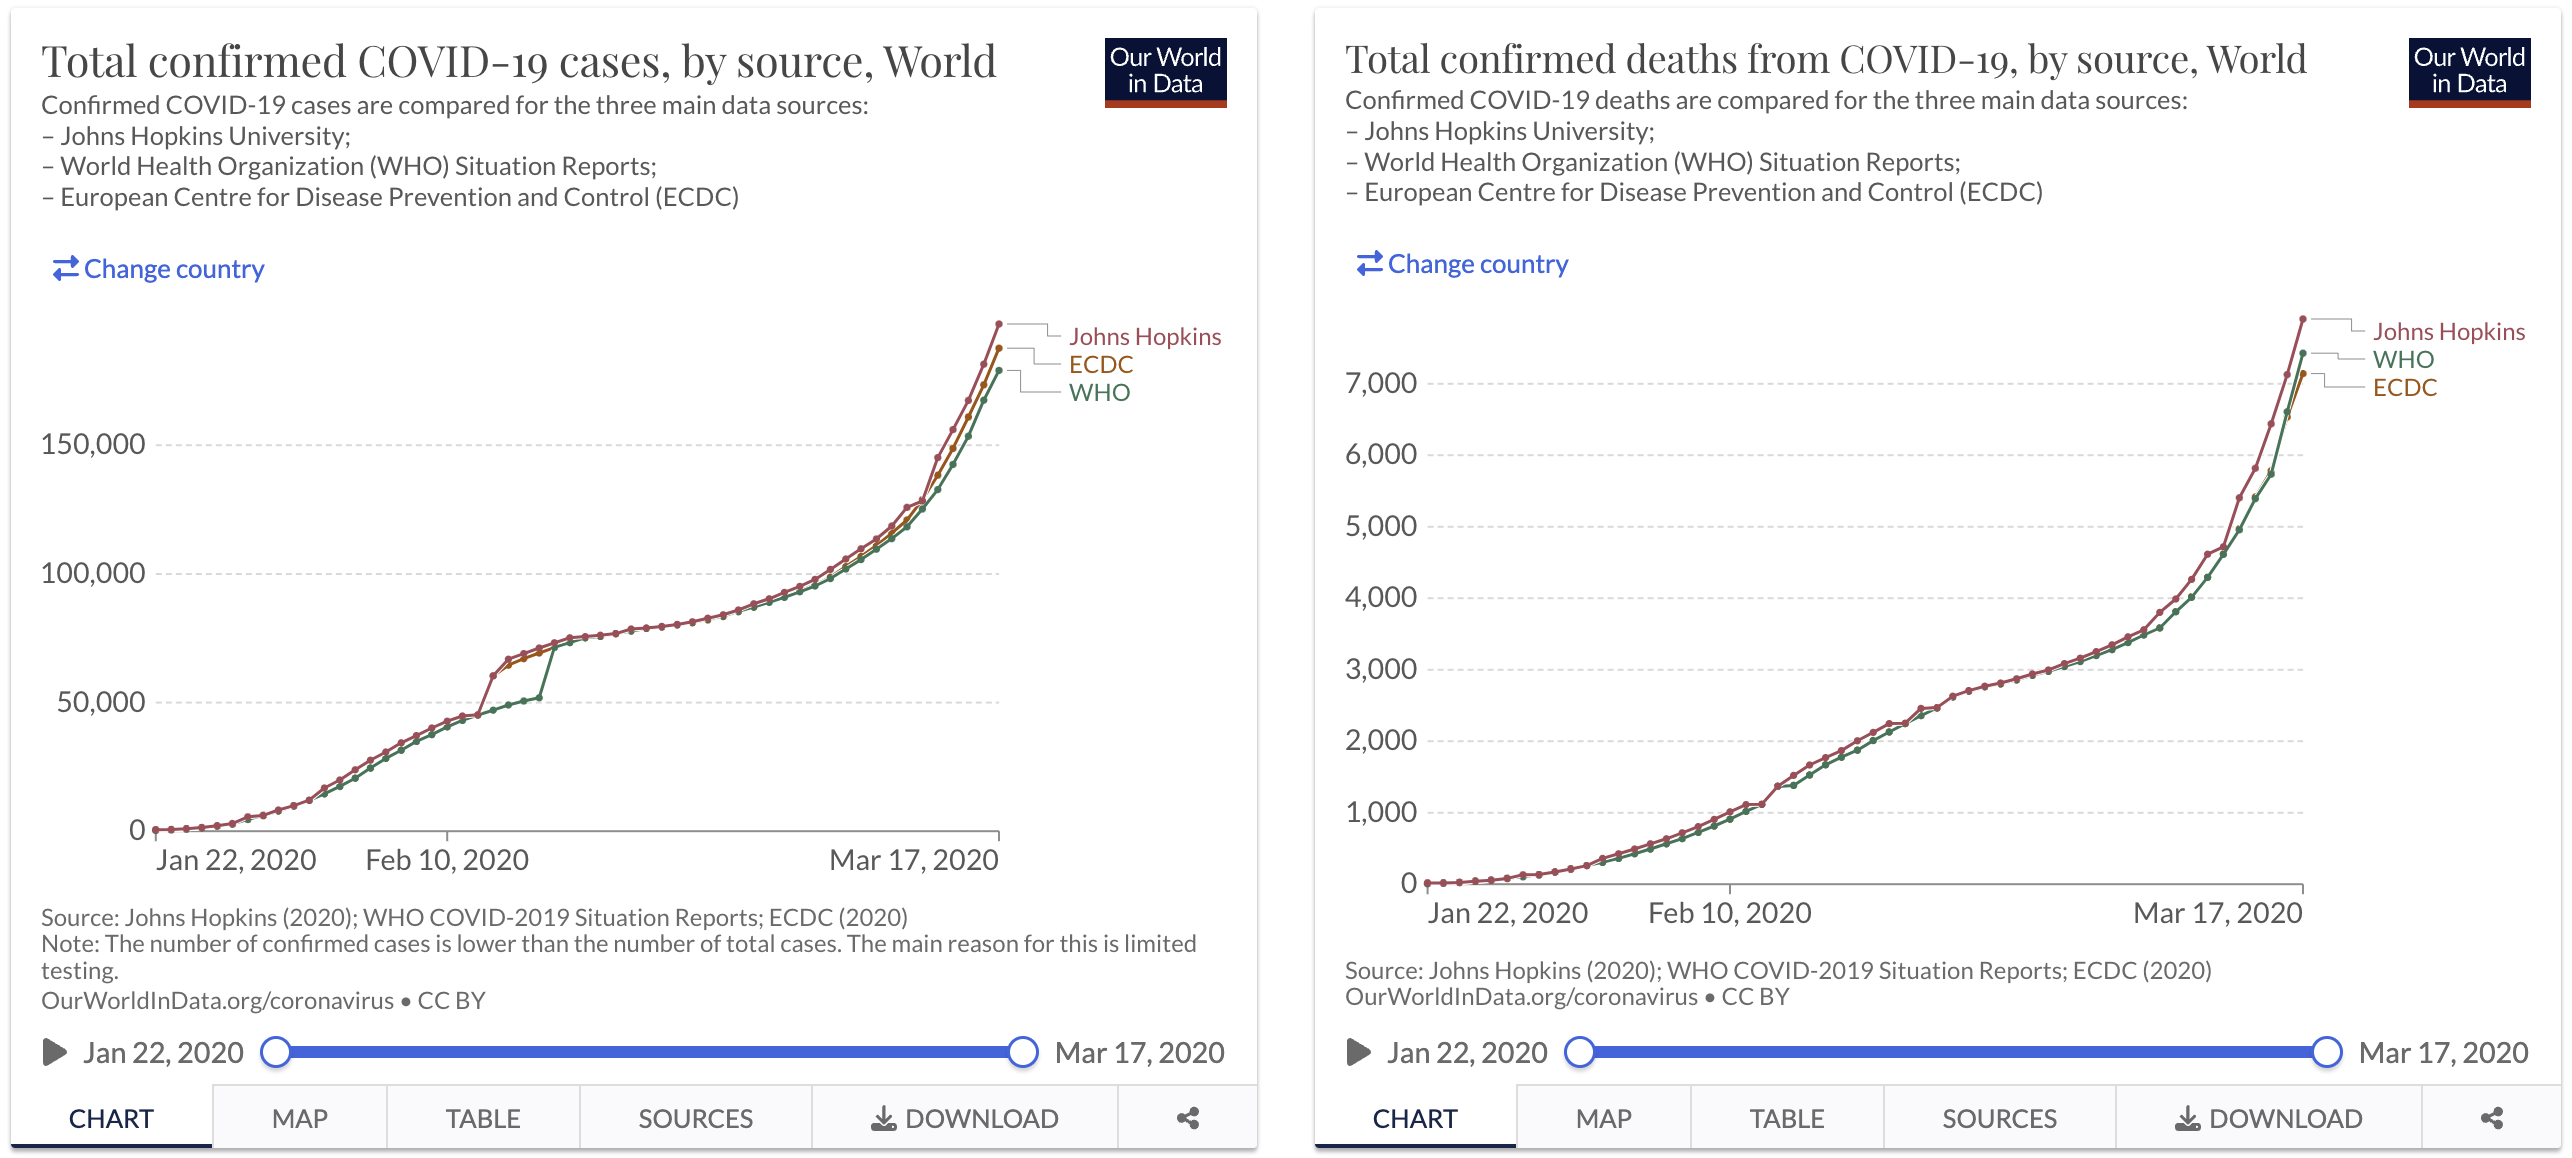
- COVID-19 Dataset by Our World in Data
- FutureSharks/financial-data: Intraday 1 minute pricing data for S&P 500, NIKKEI 225, DAX 30 and more
书籍
- Spatial Data Science with applications in R
- 使用 R 进行空间数据编程简介
- Big Book of R:各种 R 语言数据汇总
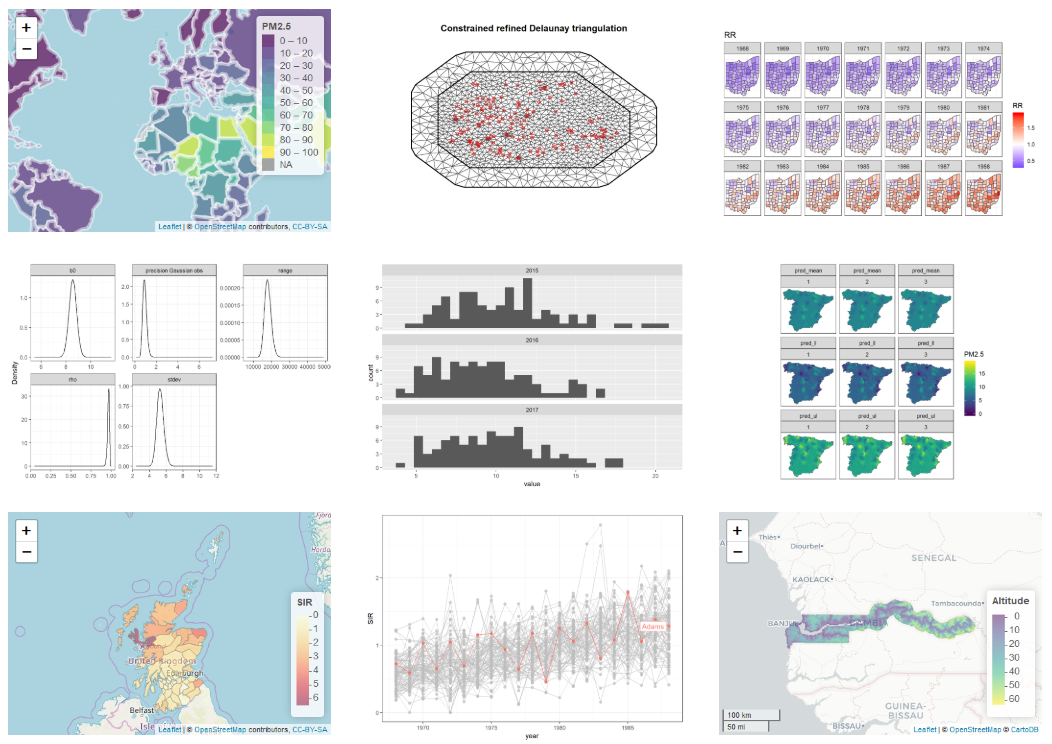
- Geospatial Health Data: Modeling and Visualization with R-INLA and Shiny
Feature Engineering and Selection: A Practical Approach for Predictive Modelsv
Interactive web-based data visualization with R, plotly, and shiny
R 语言
- awesome-ggplot2: A curated list of awesome ggplot2 tutorials, packages etc.:ggplot2 的一些教程、包等。
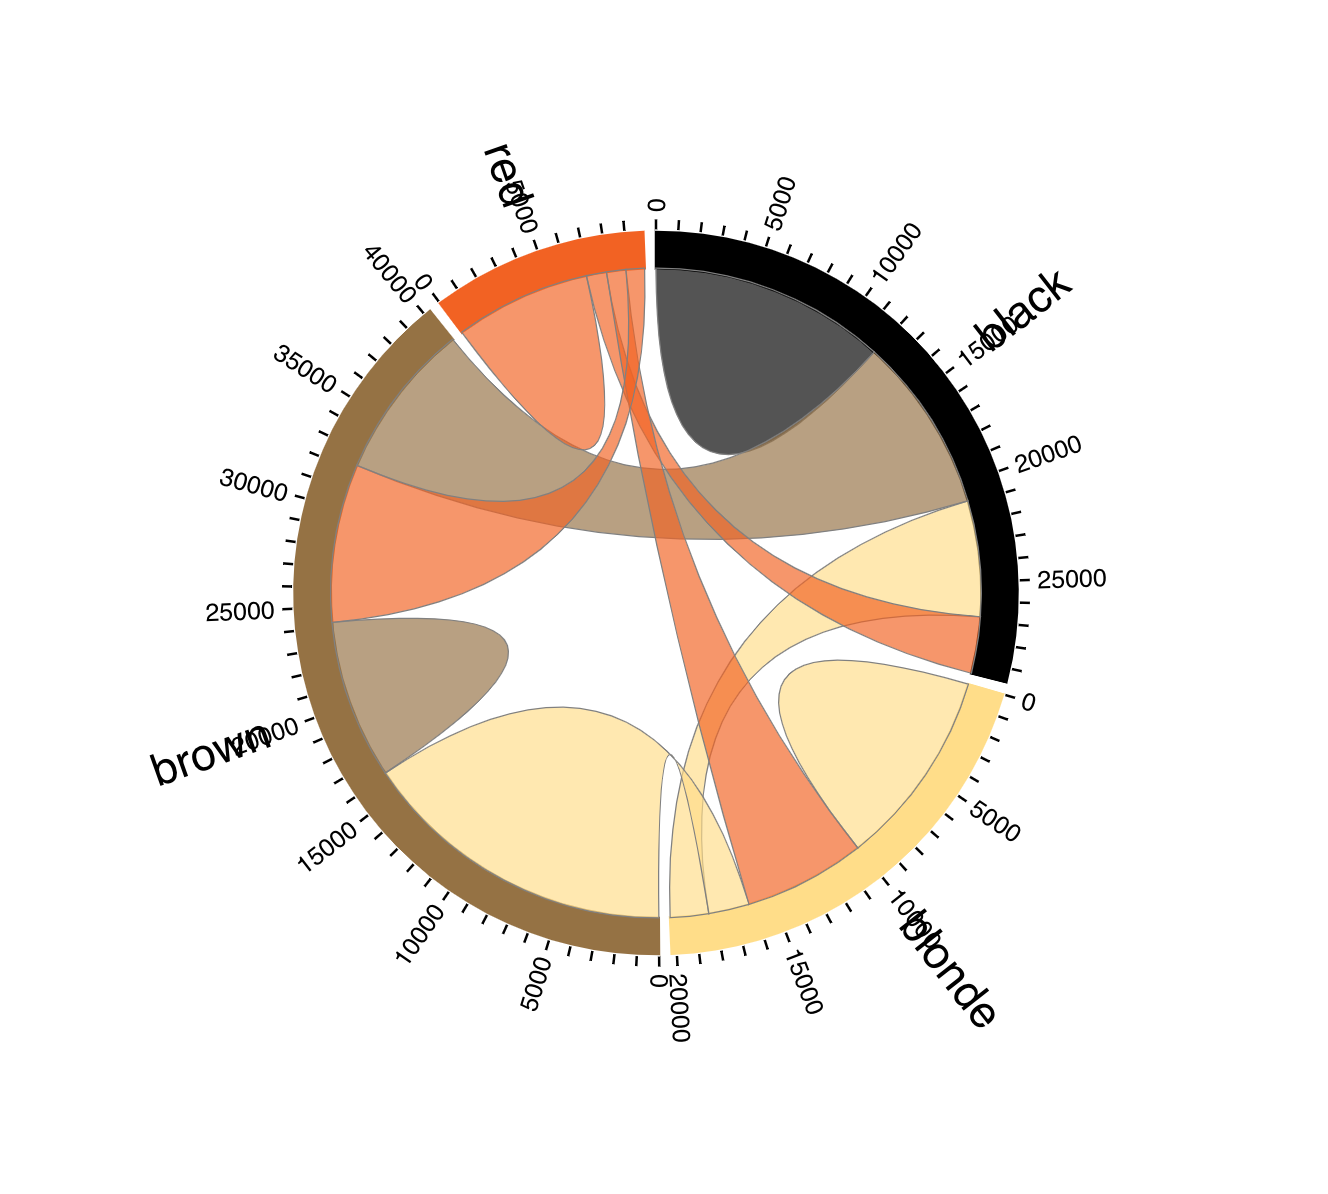
- mattflor/chorddiag: R interface to D3 chord diagrams:基于 D3.js 绘制和弦图的 R 包
# devtools::install_github("mattflor/chorddiag") |
- jmcastagnetto/ggplot2_themes_in_github: A generated list of repos containing themes/styles for ggplot2:ggplot2 的绘图主题列表。
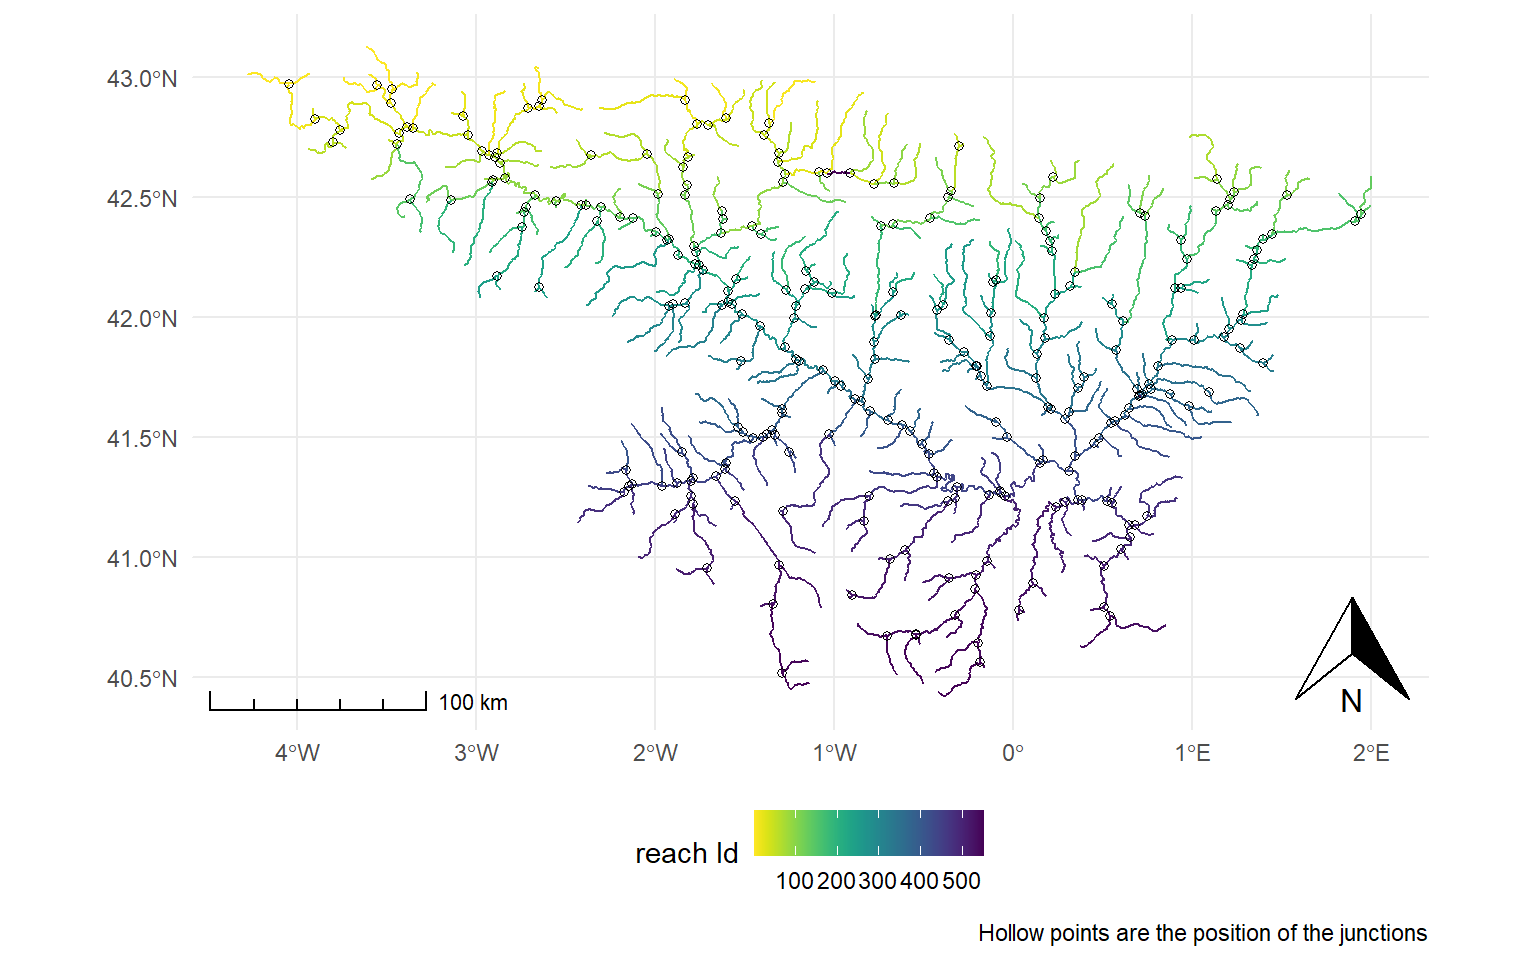
- Tutorial to create igraph objects from spatial data and calculate fragmentation indices with riverconn:从空间数据创建 igraph 对象并使用 riverconn 计算碎片指数的教程
- r-lib/pillar: Format columns with colour
- Reading Zarr files with R package stars
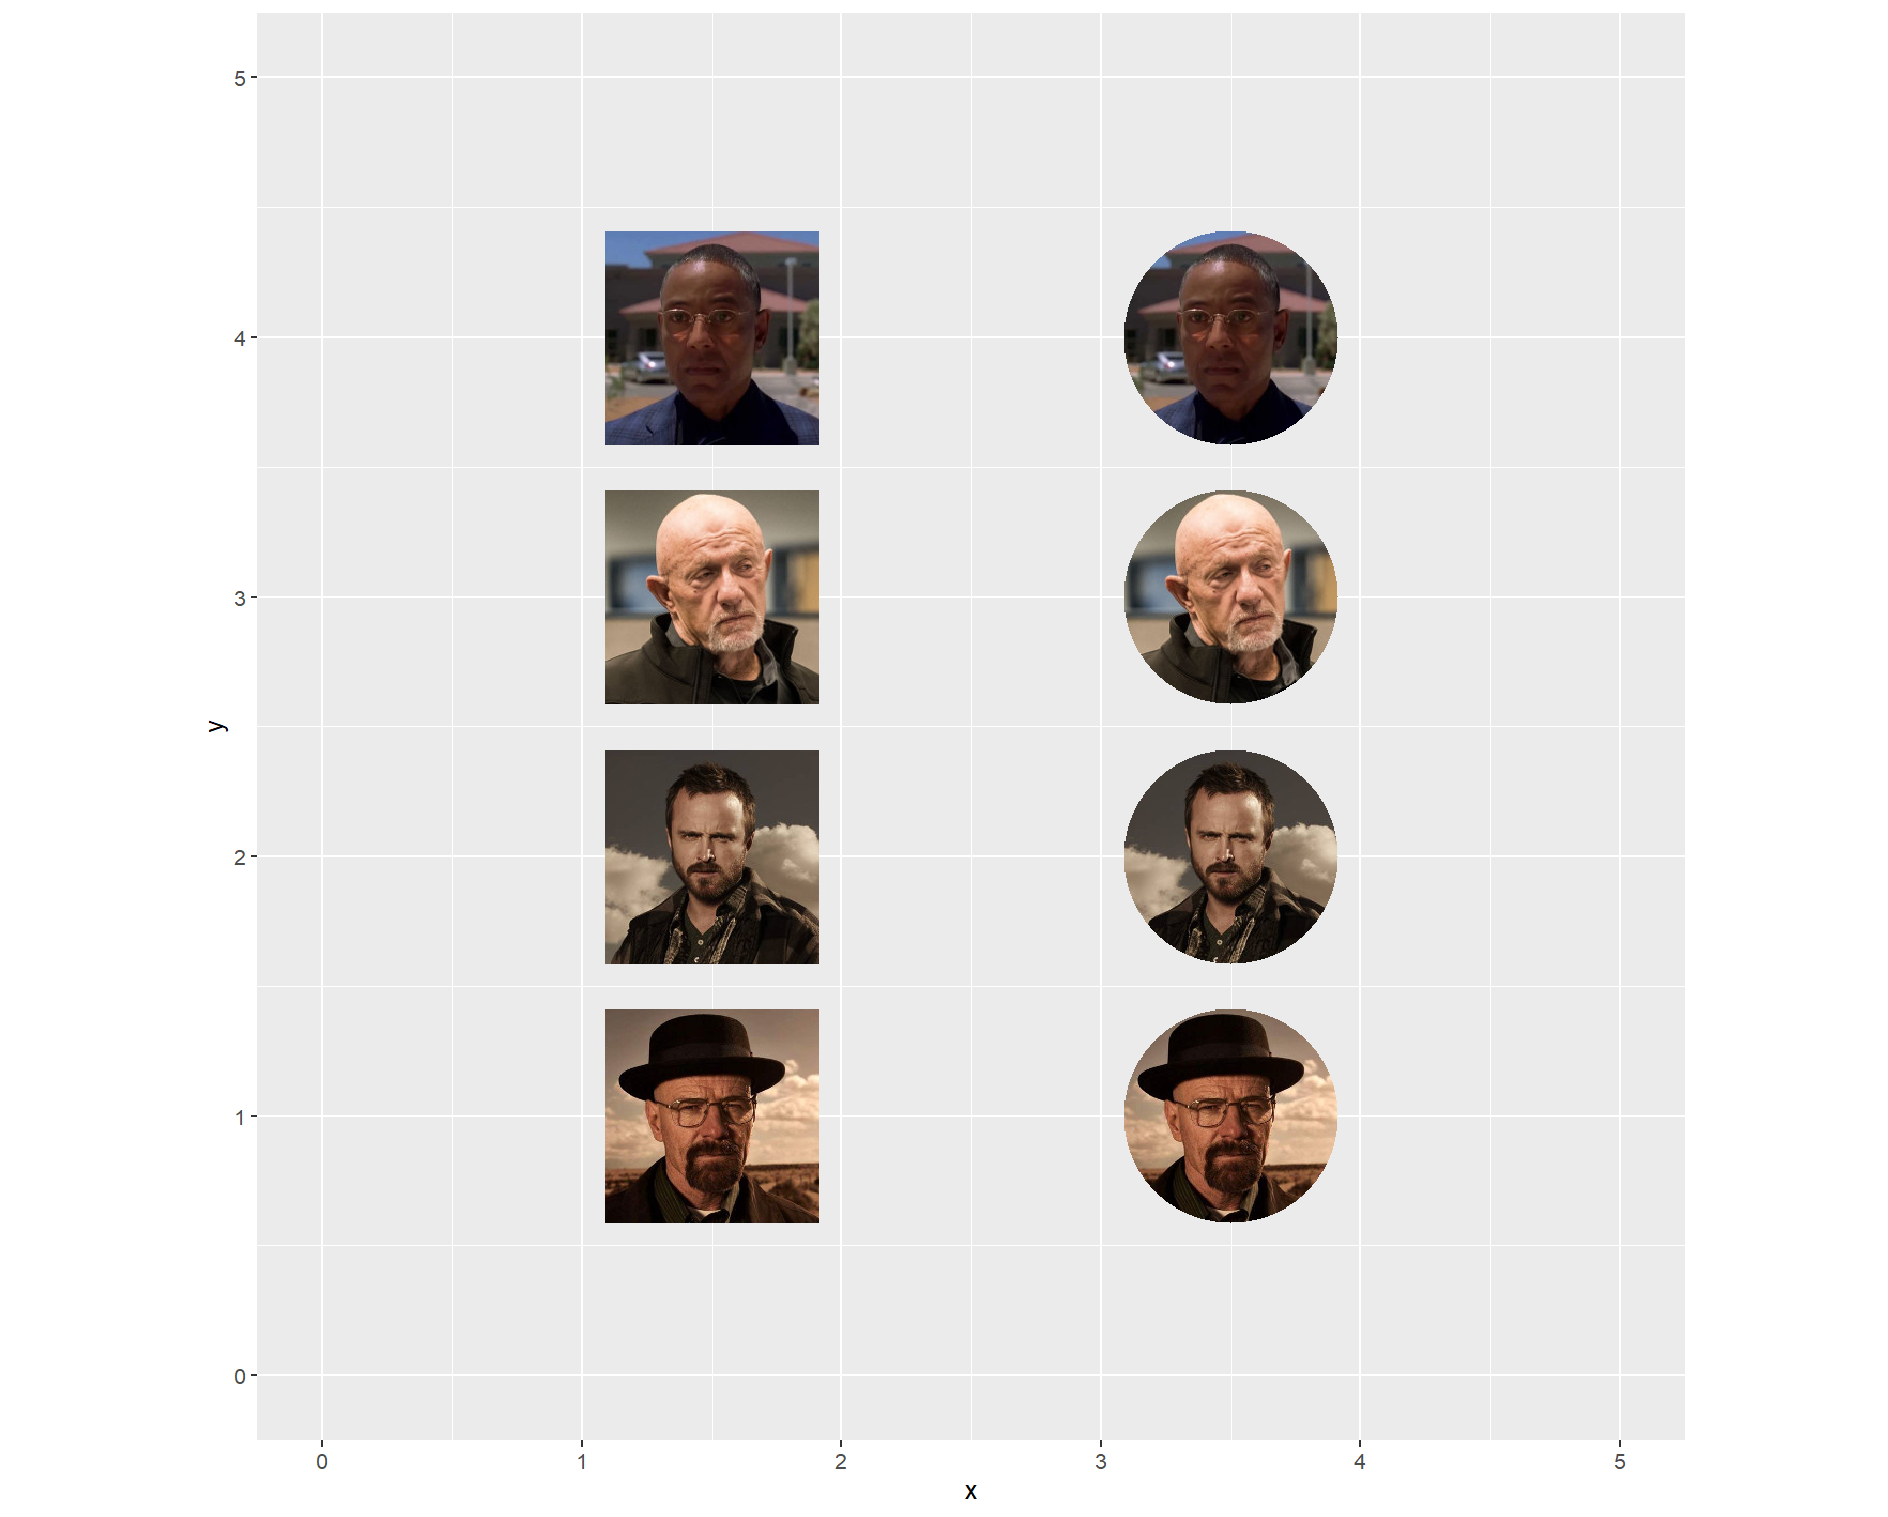
- Crop an image into a circle with a transparent background.
- tidyterra: tidyverse and ggplot2 methods for terra spatial objects
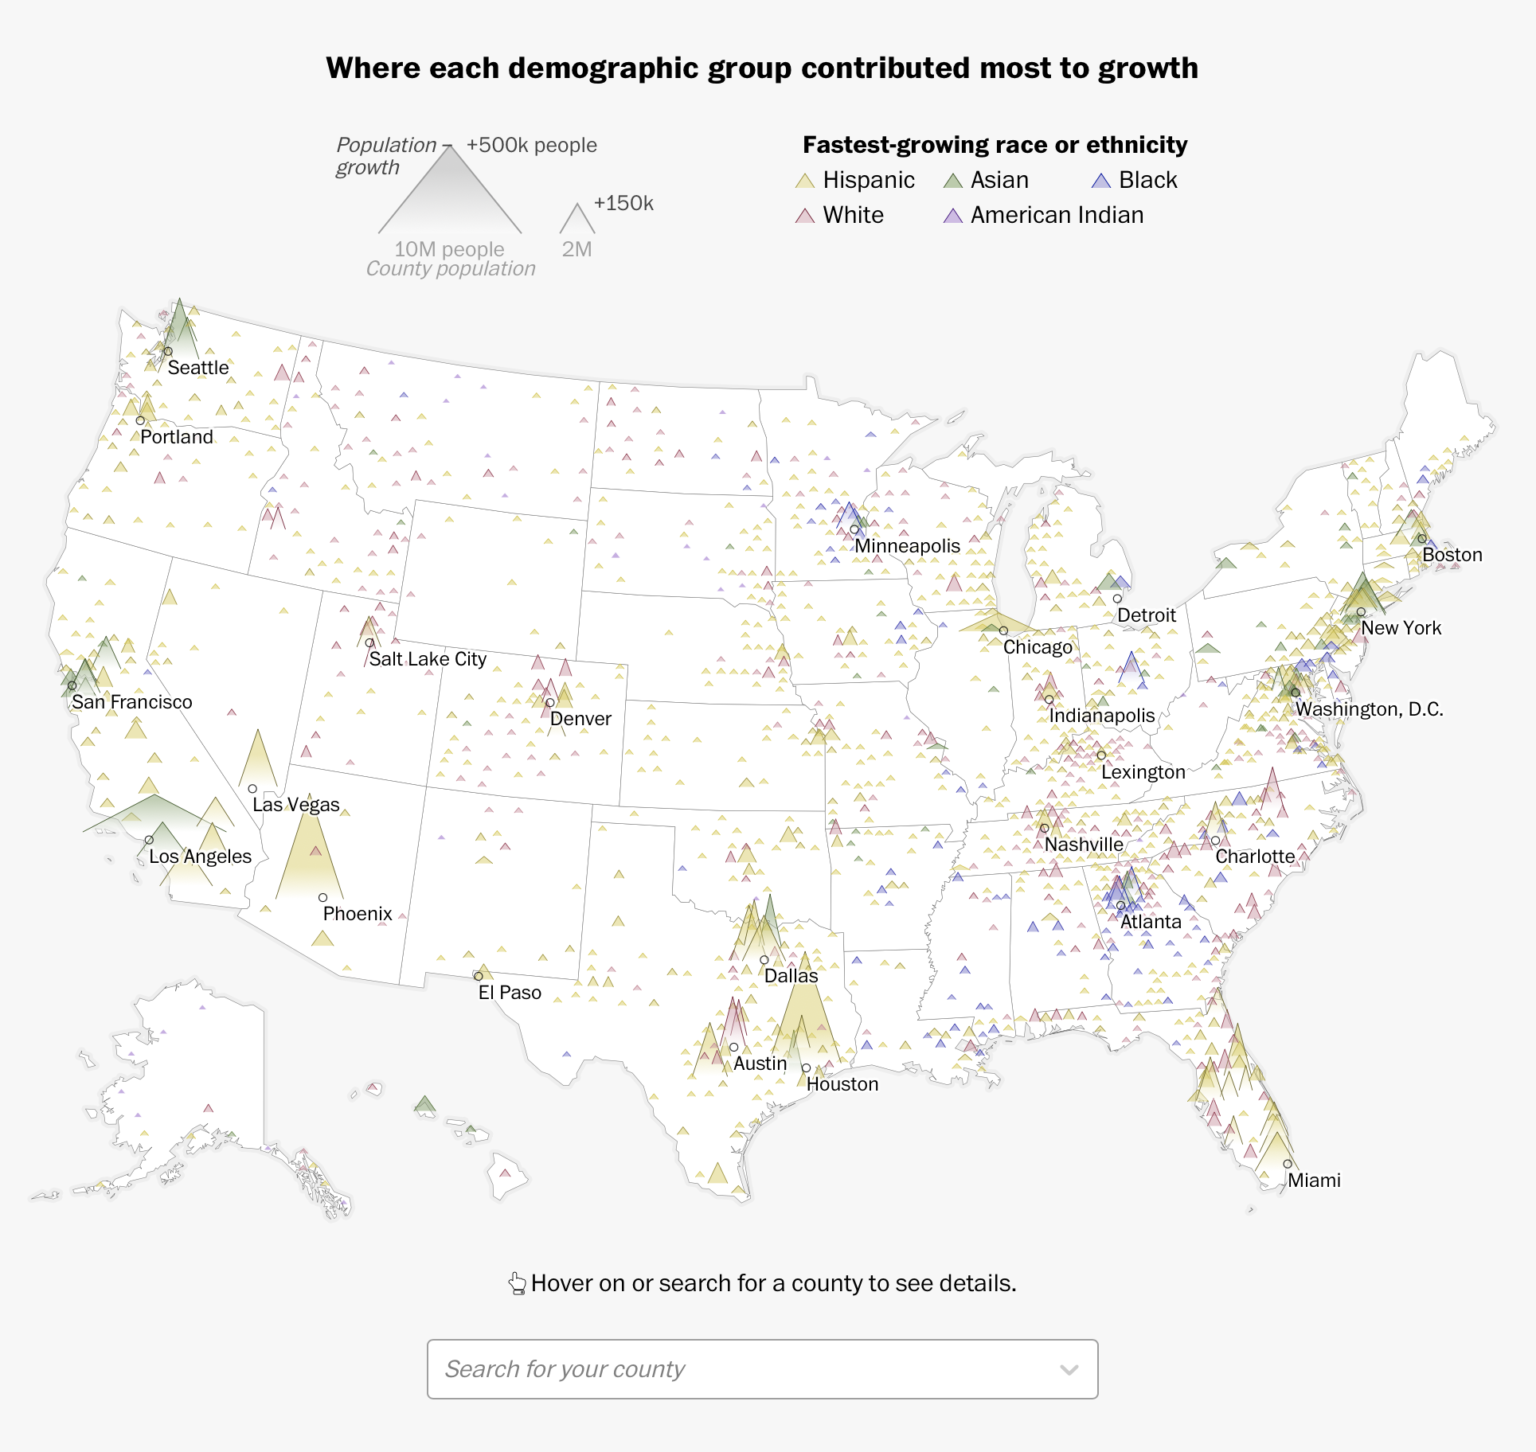
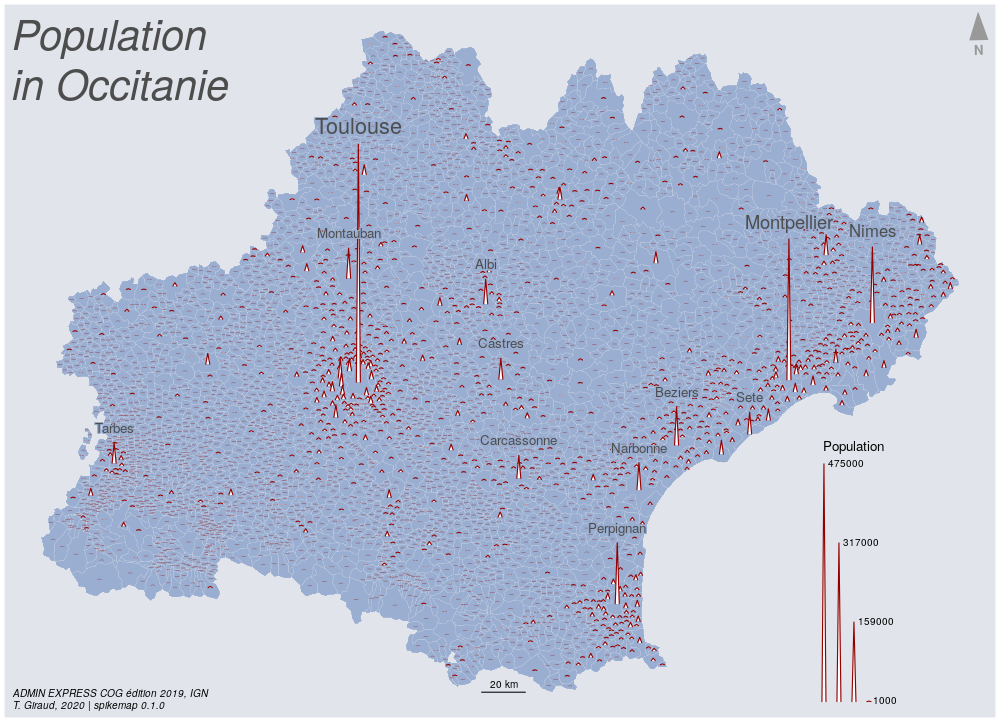
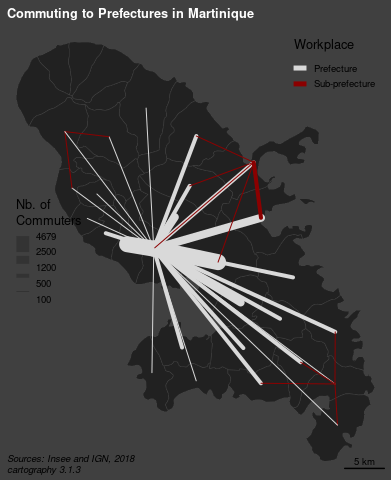
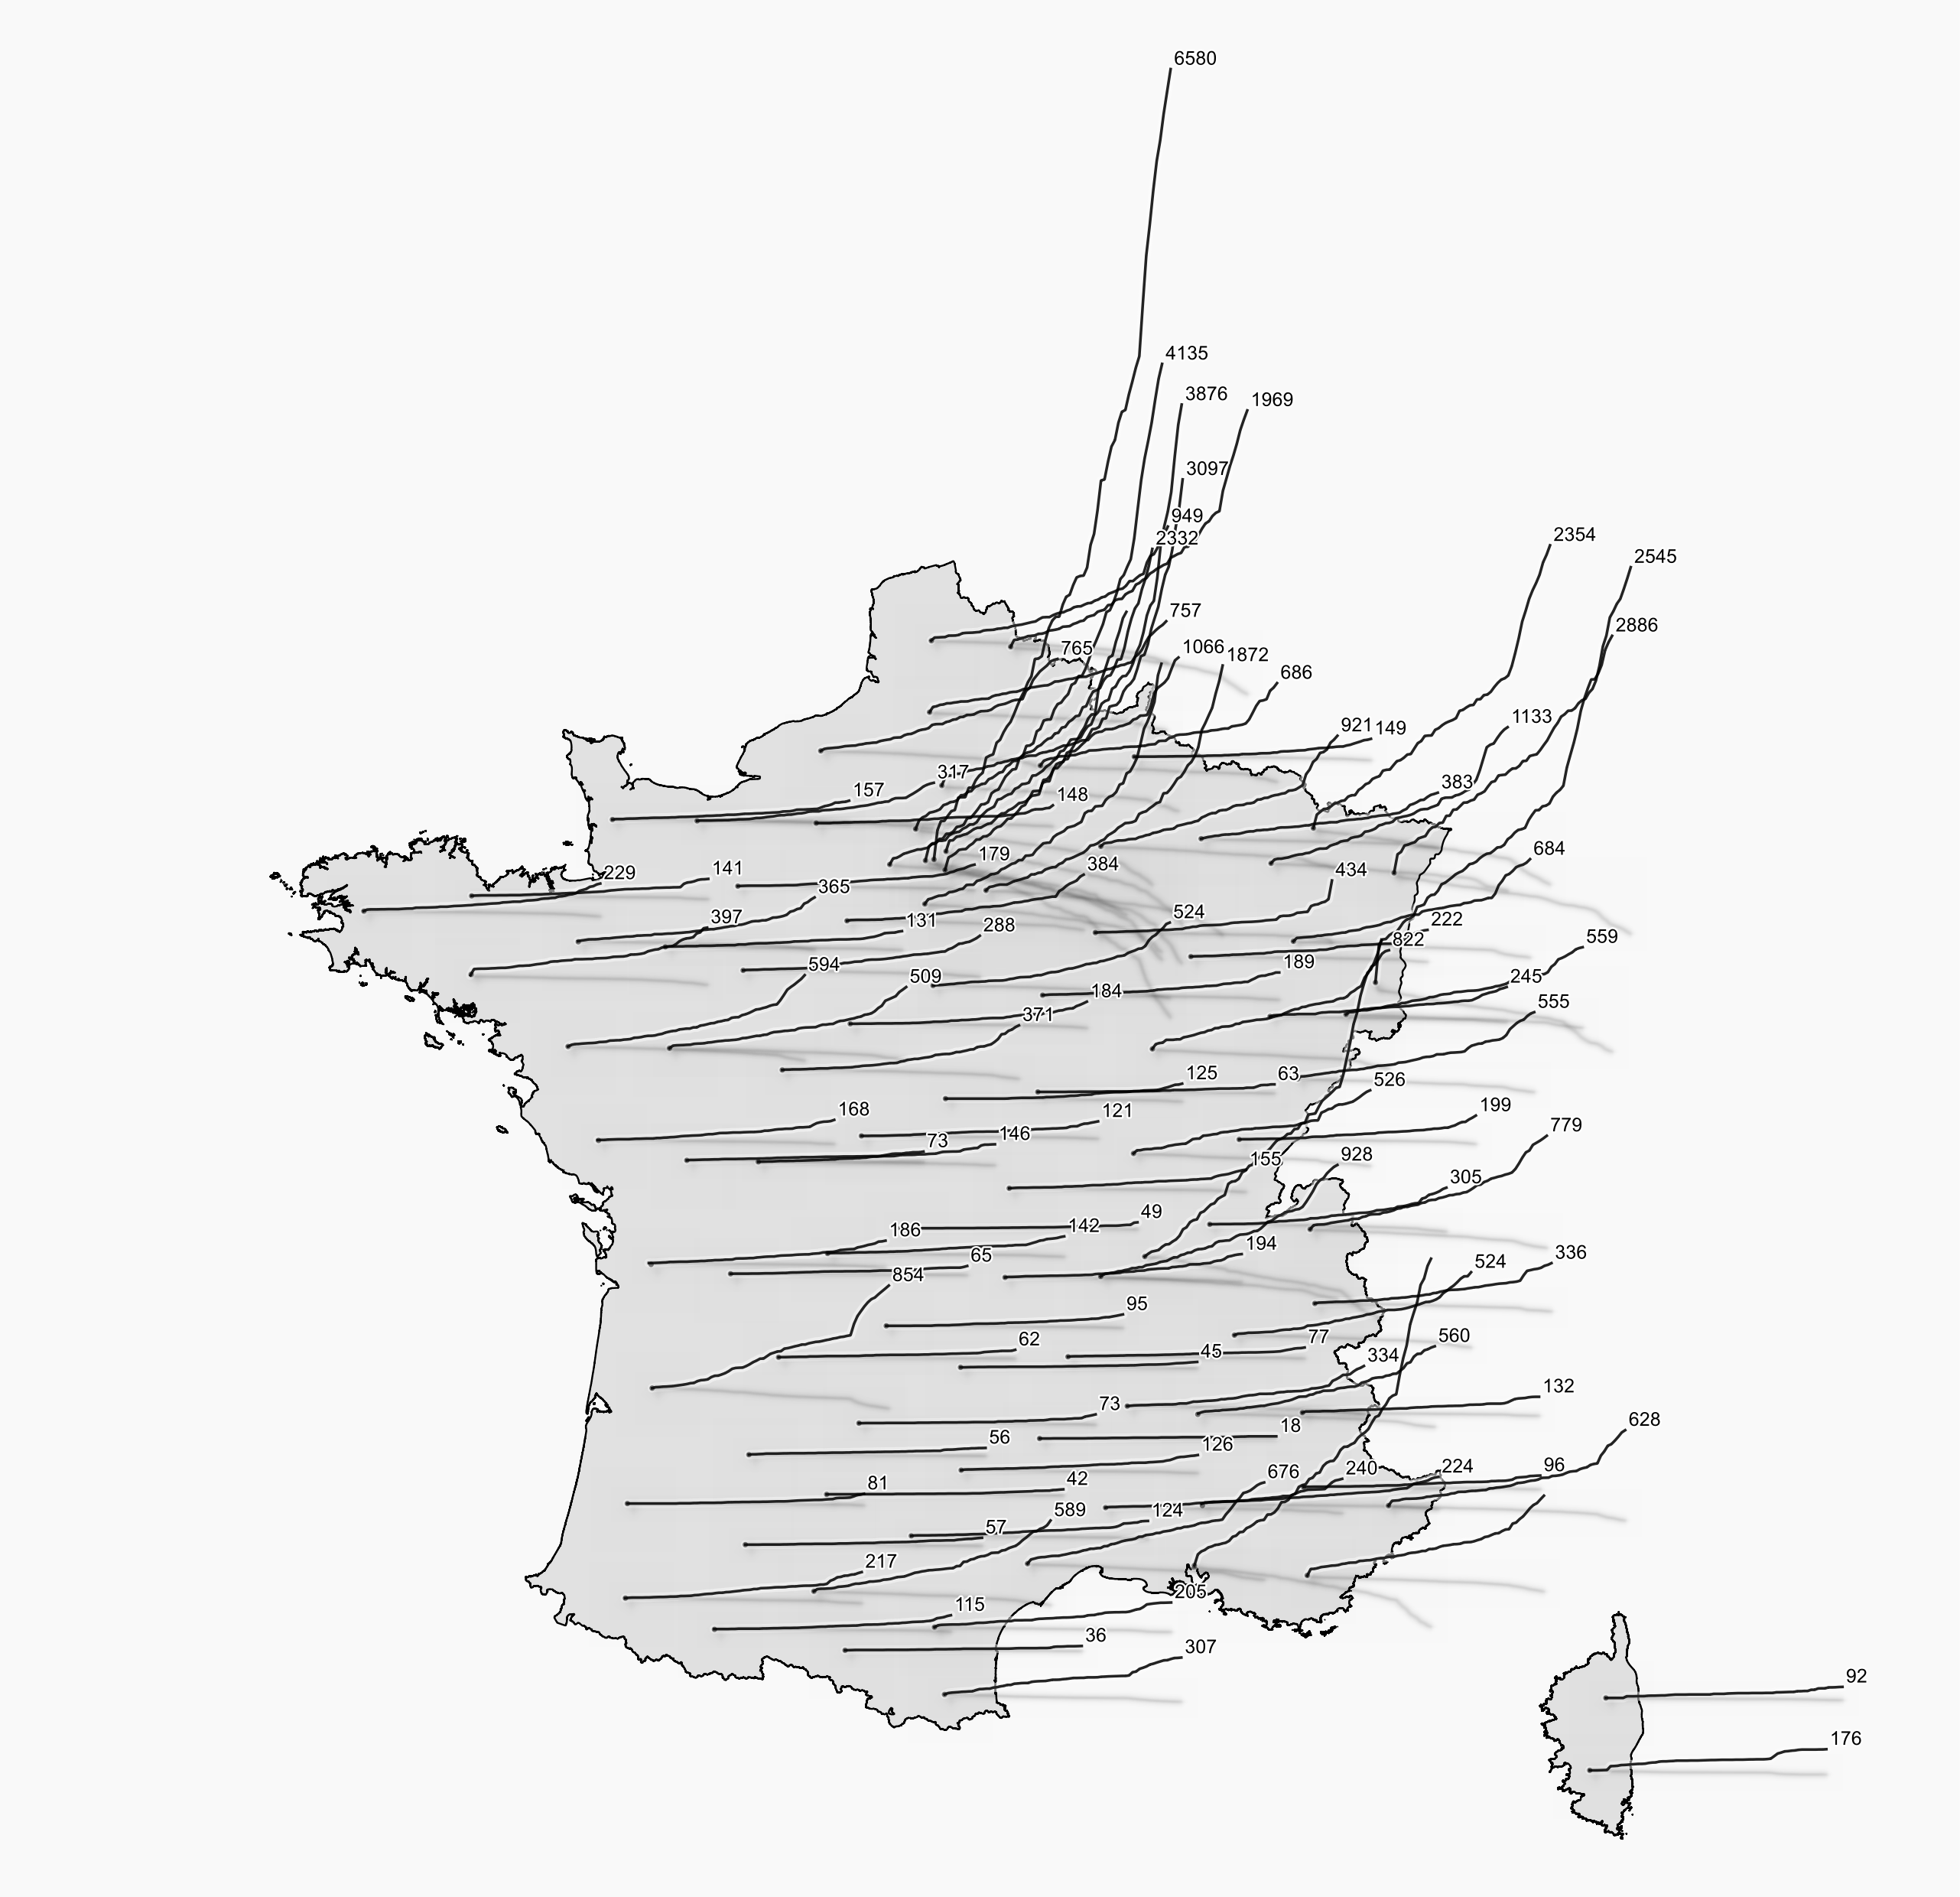
- rCarto/spikemap: Maps made of spikes
- wenyalintw/Google-Patents-Scraper:自动下载所有在 Google Patents 上找到的搜索结果及其专利家族的 PDF 文件。
- The Size of Space
- Exporting editable plots from R to Powerpoint: making ggplot2 purrr with officer
- K-means clustering with tidy data principles
- igjit/nrc: A toy R compiler in R
- The R Graph Gallery – Help and inspiration for R charts
- yonicd/shinycarbon
- stemangiola/tidyHeatmap: Draw heatmap simply using a tidy data frame
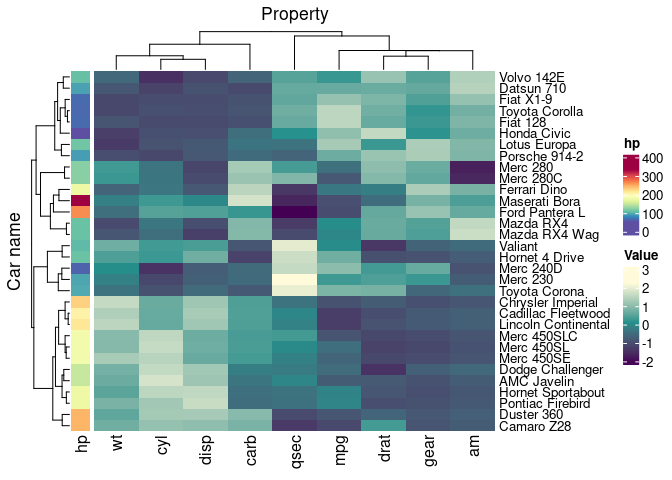

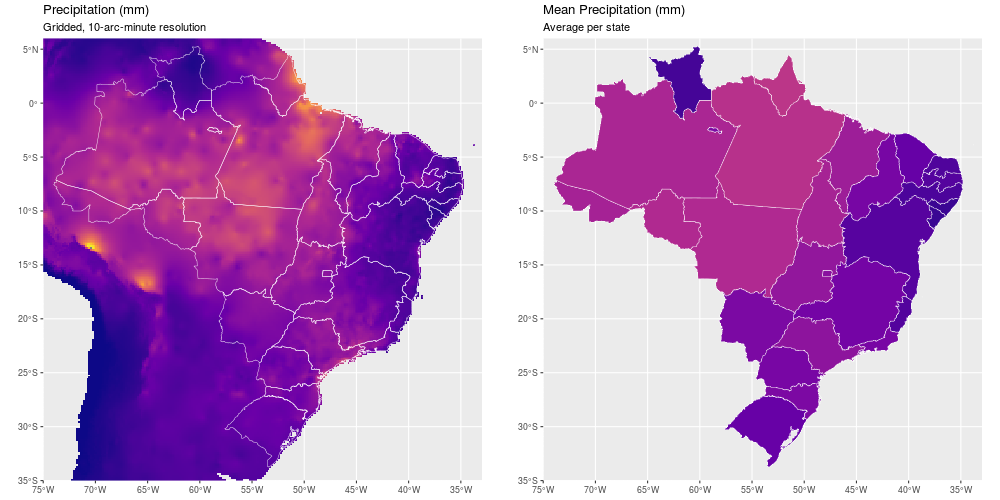
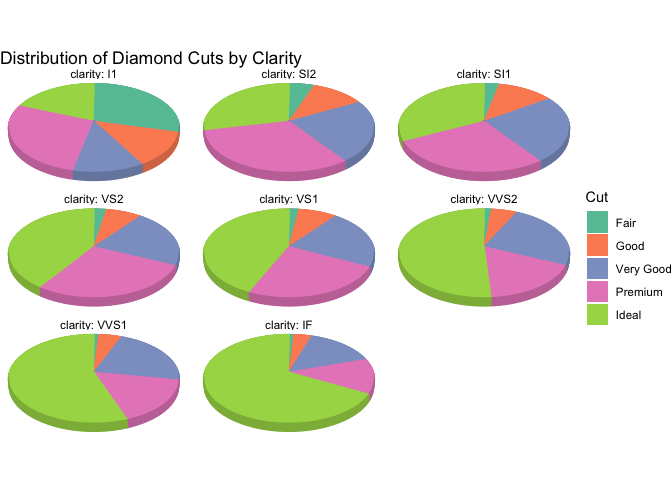
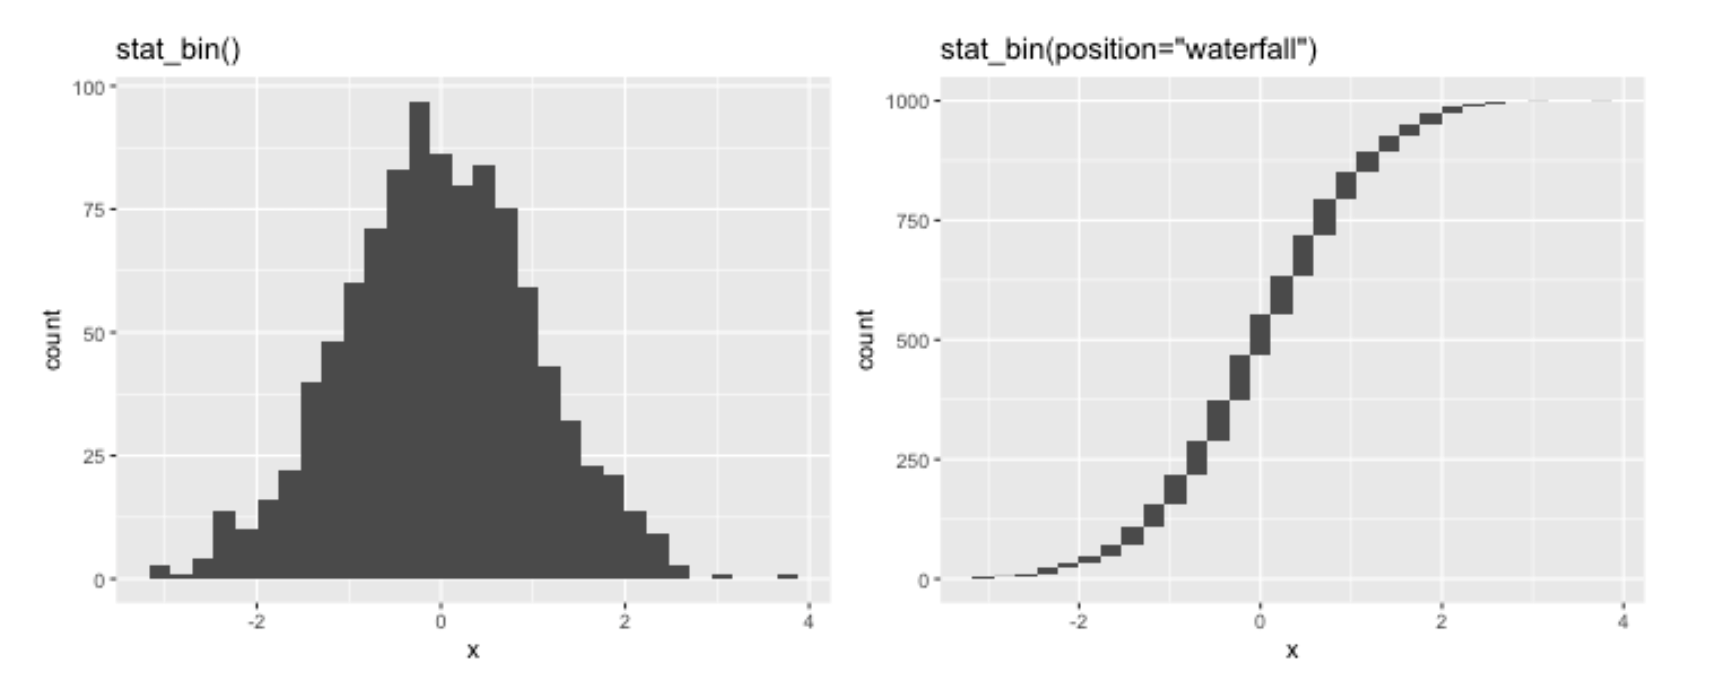
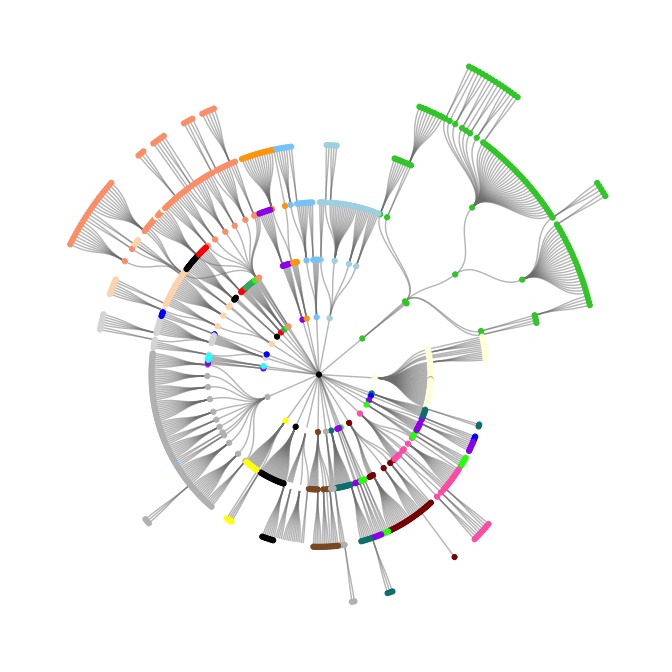

- hrbrmstr/imago: 🗺Hacky World Map GeoJSON Based on the Imago Projection
- Use tidy data principles to interact with HTML files!
- Geom Gallery - Geometry-based Patterns • ggpattern
- delabj/ggCyberPunk: Working on creating a similar cyberpunk geom for ggplot

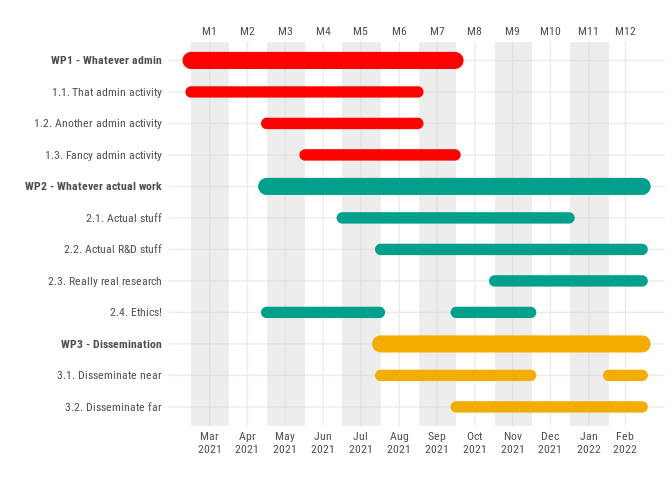
- mdsumner/plusraster: A sandbox for me to learn ggplot2 and bring GDAL lazy data read to a geom
- statsmaths/ggmaptile: Add Map Images from a Tile Server with ggplot2

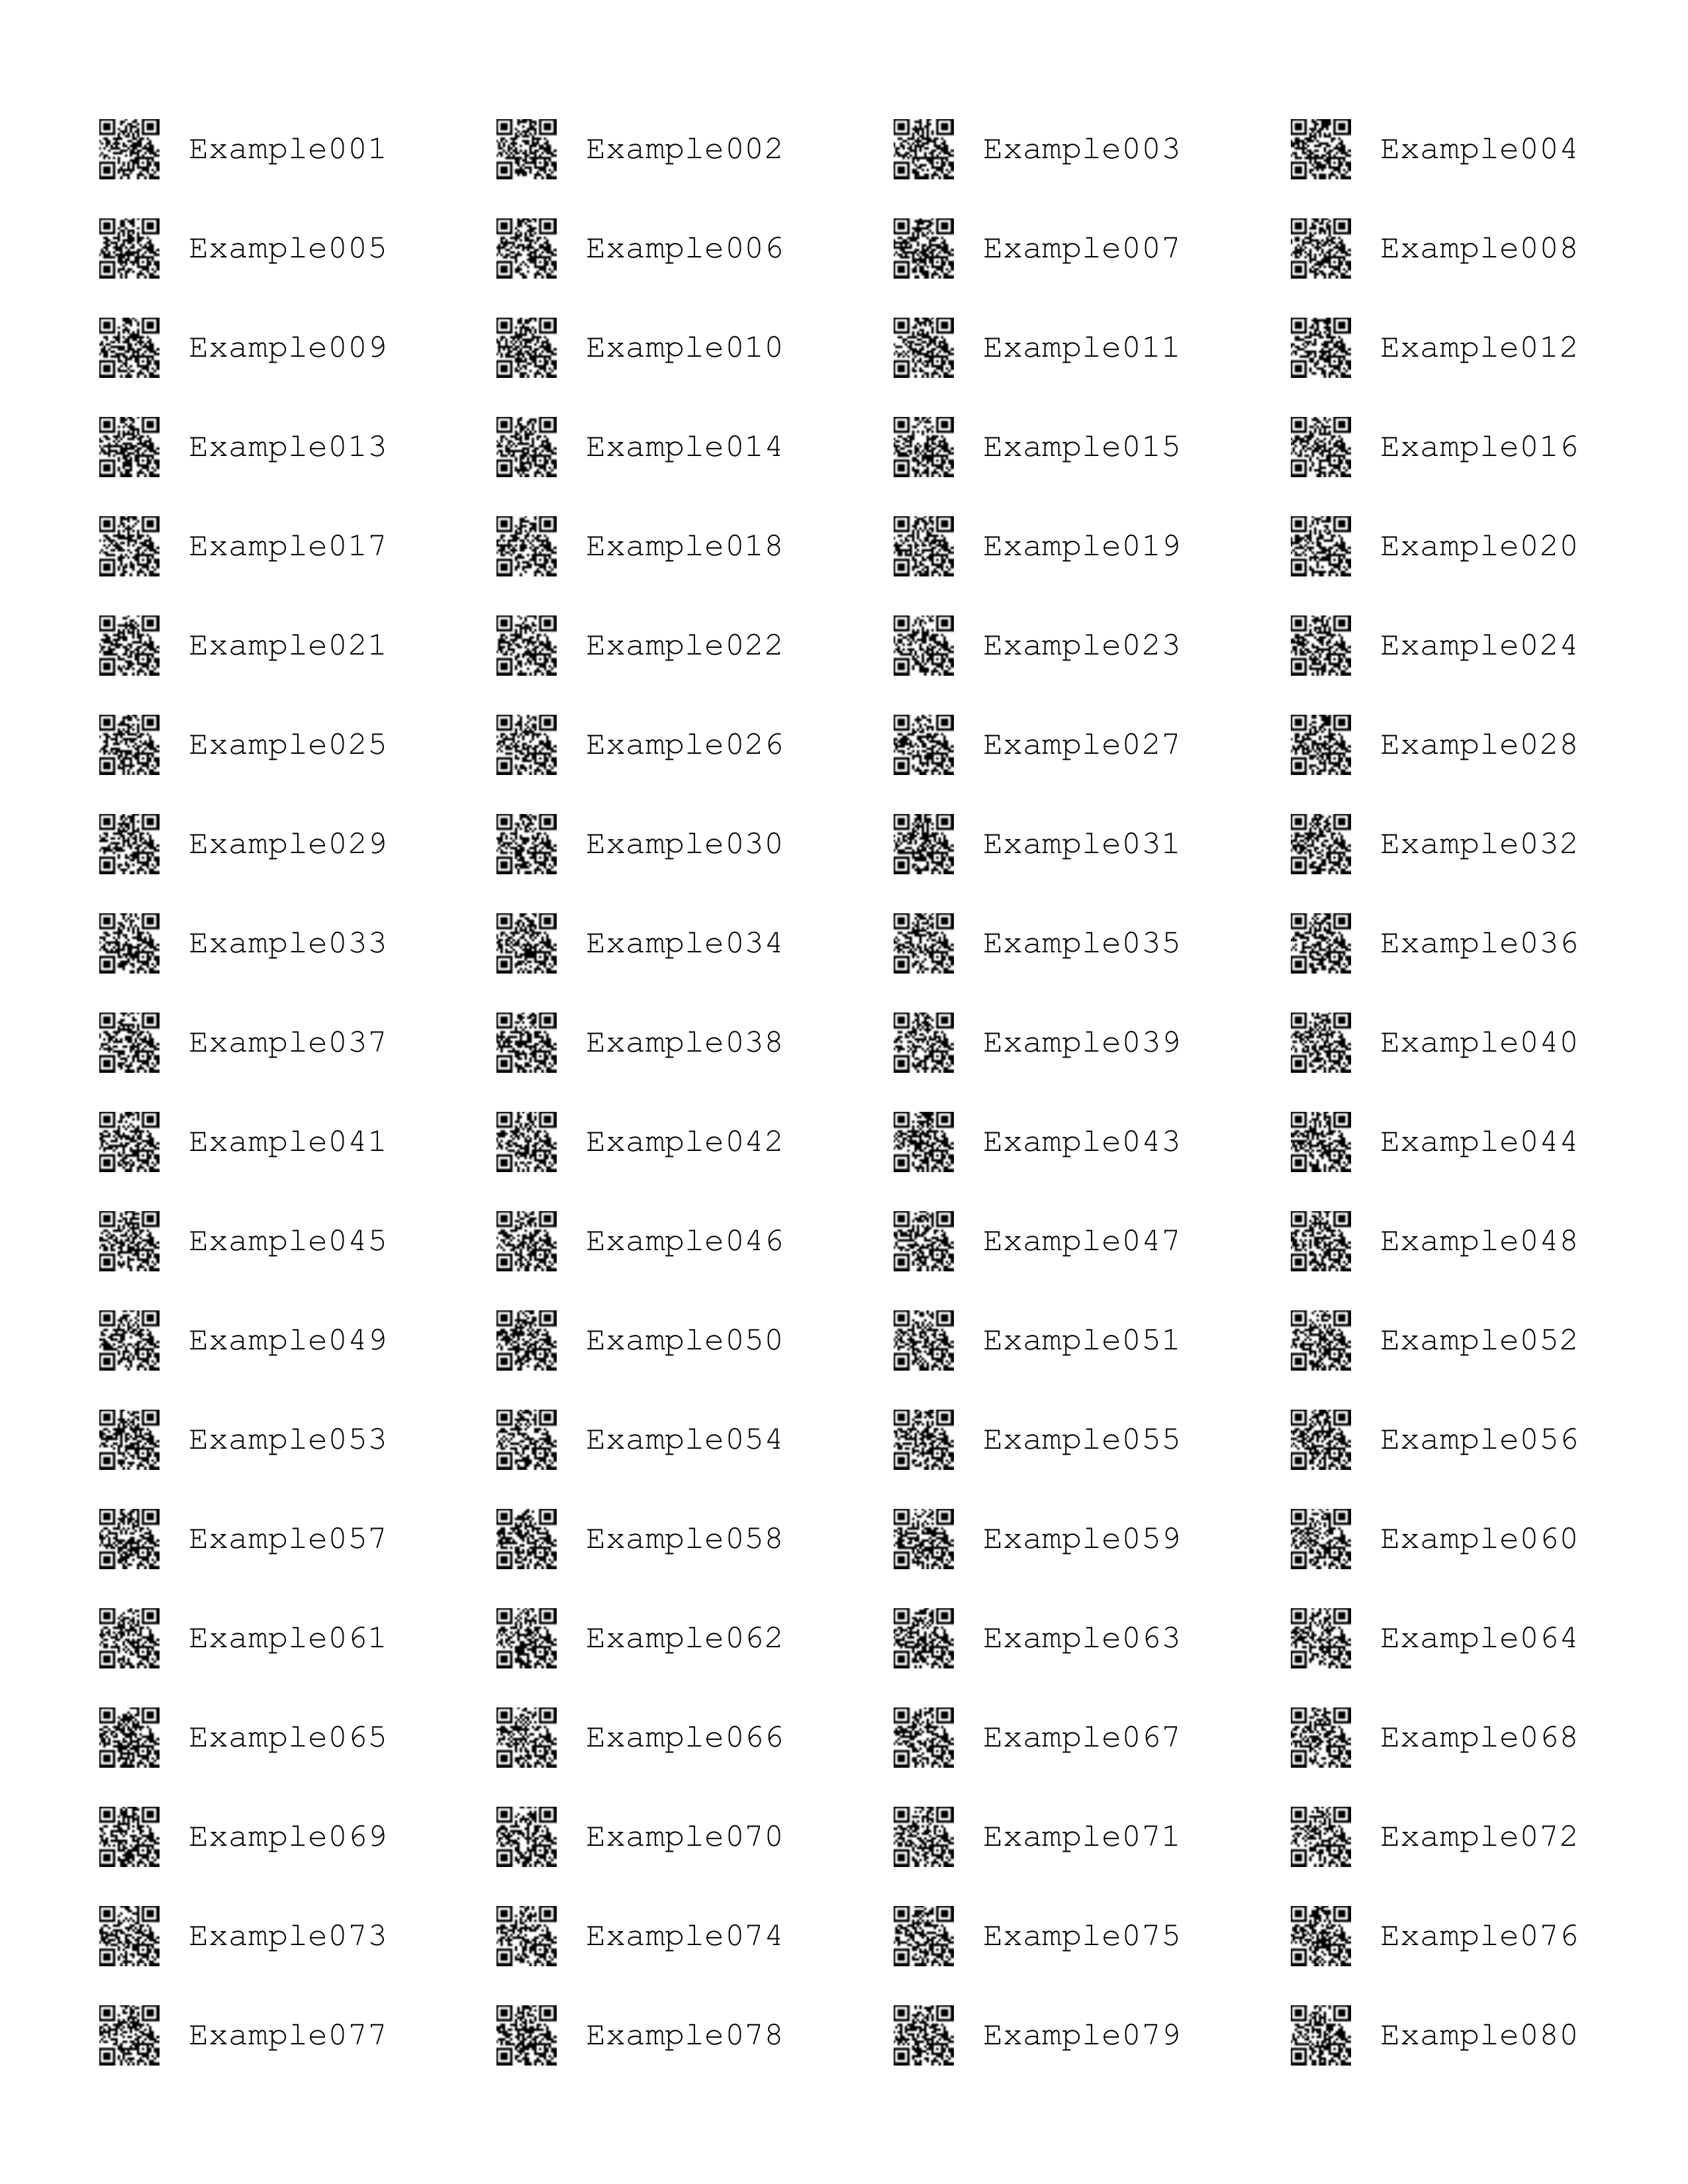
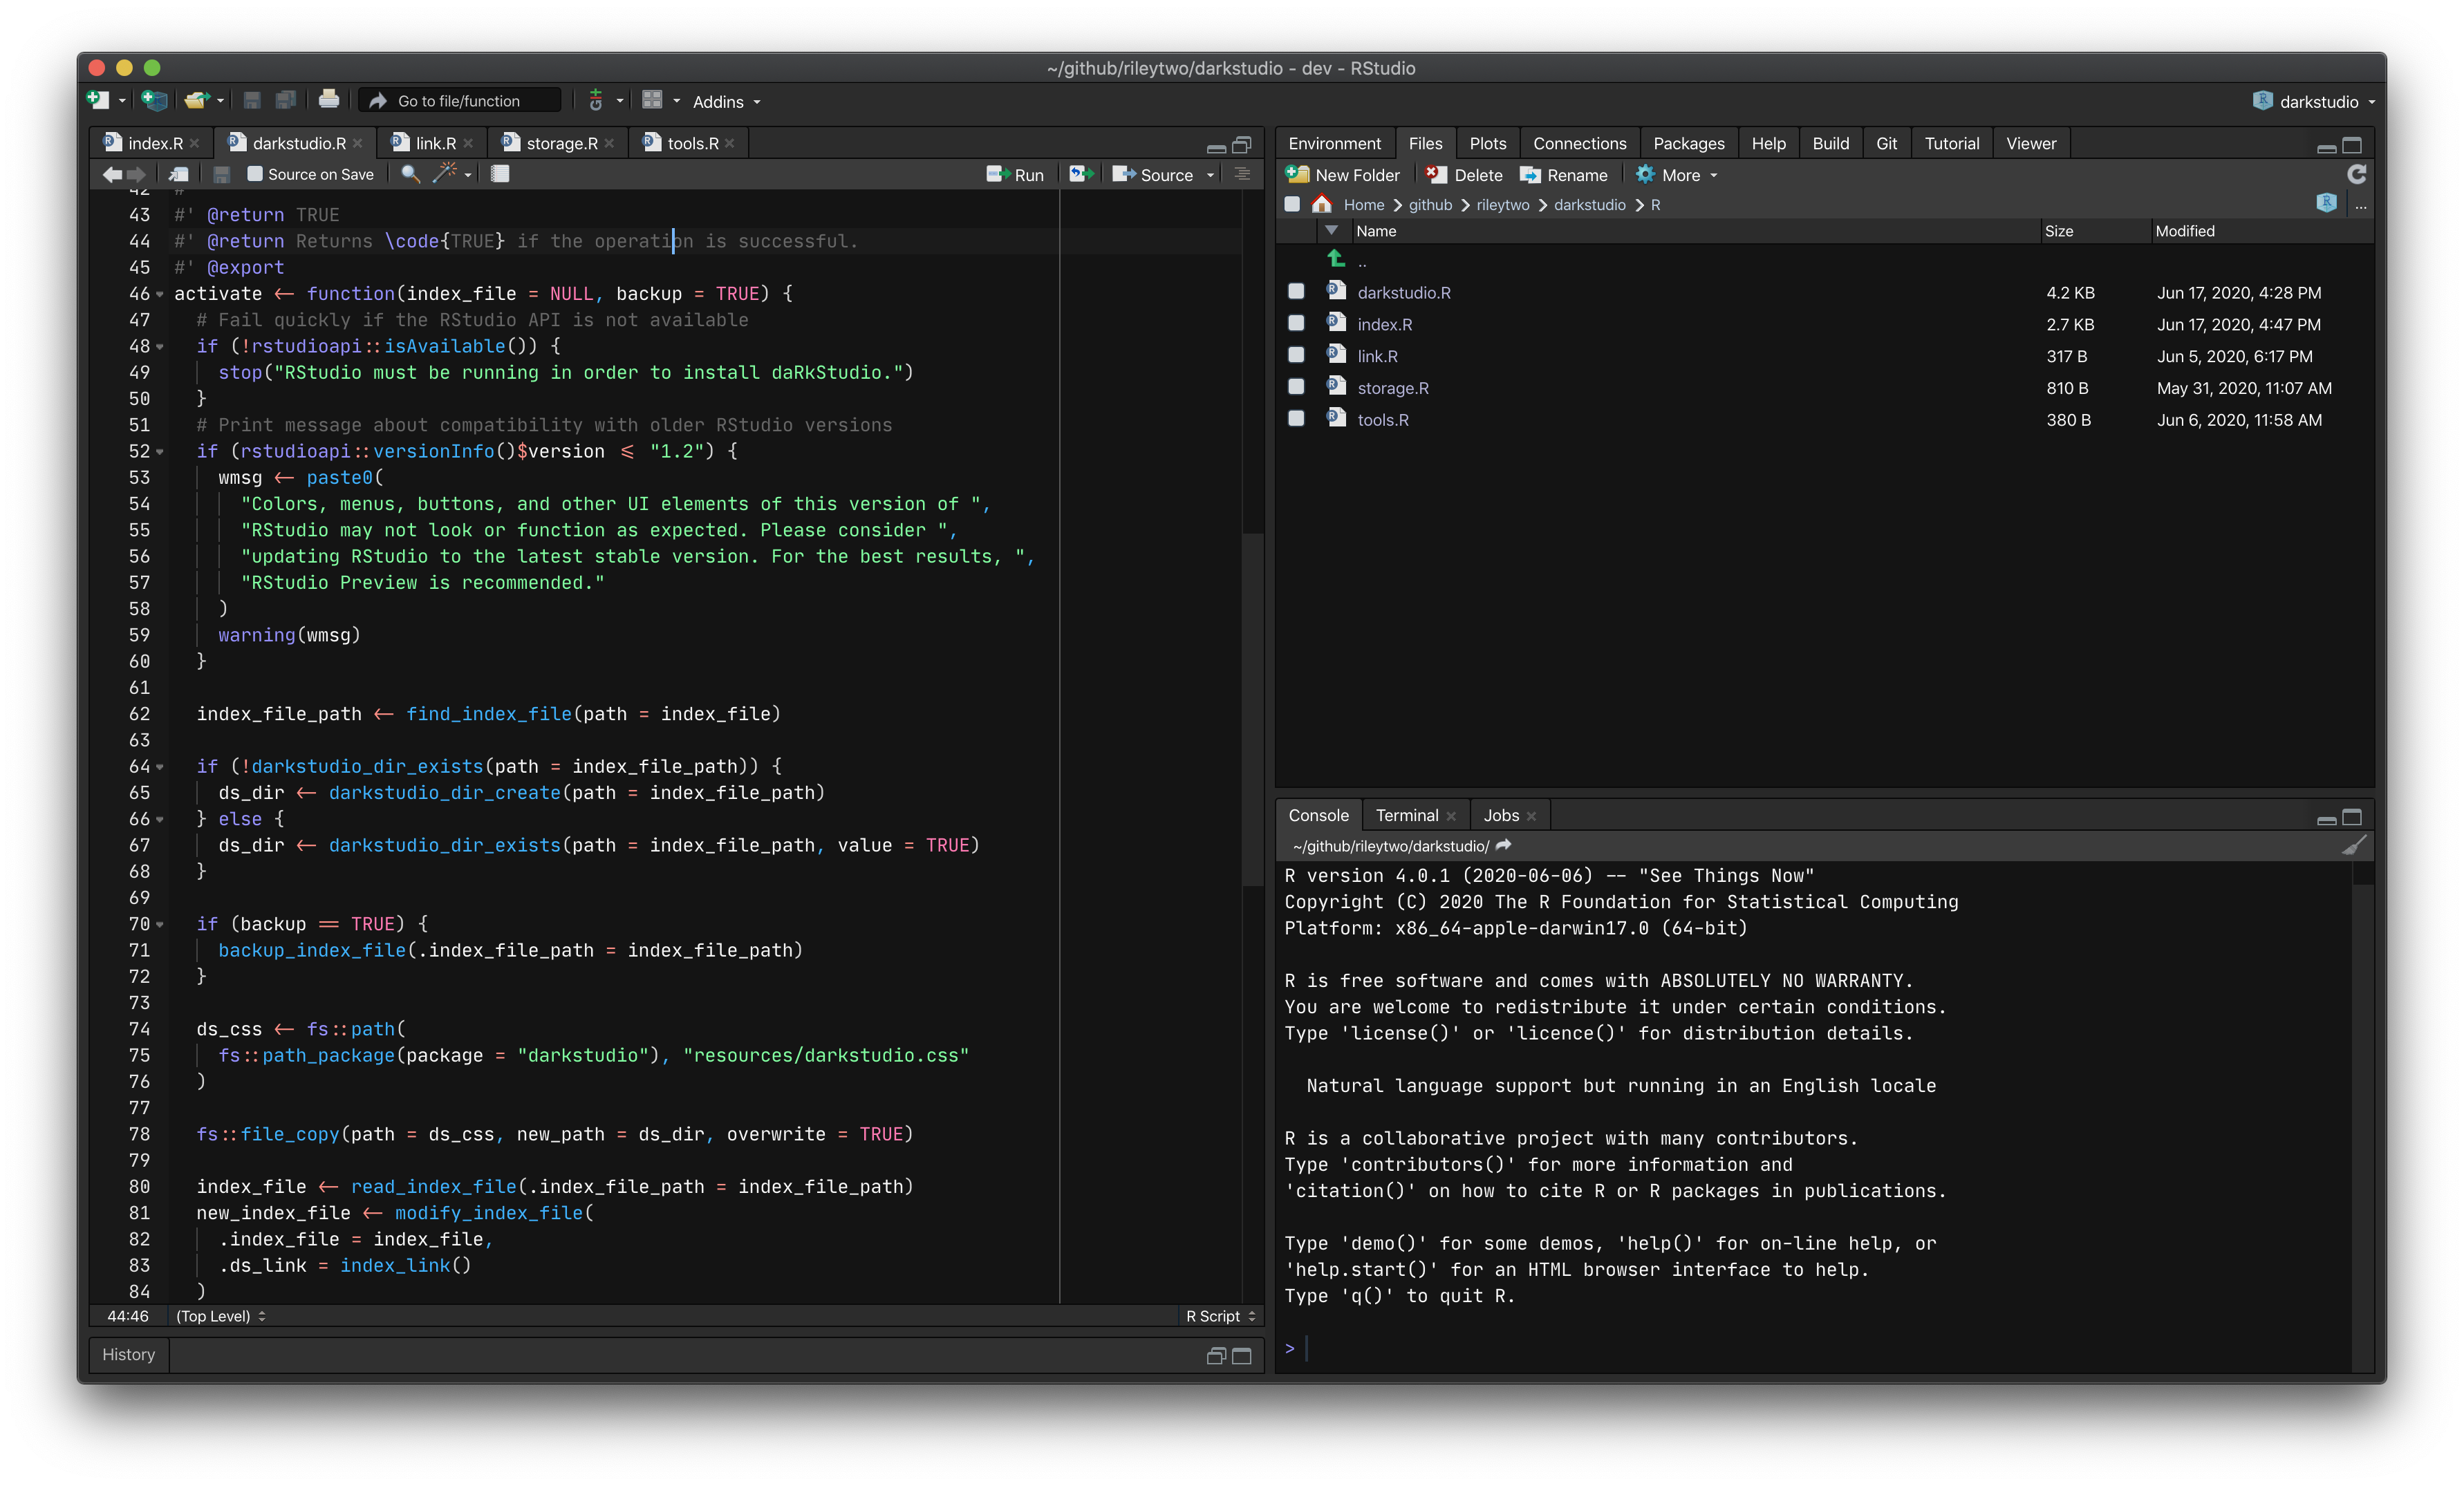
knitr::opts_chunk$set(dev = "cairo_pdf") |
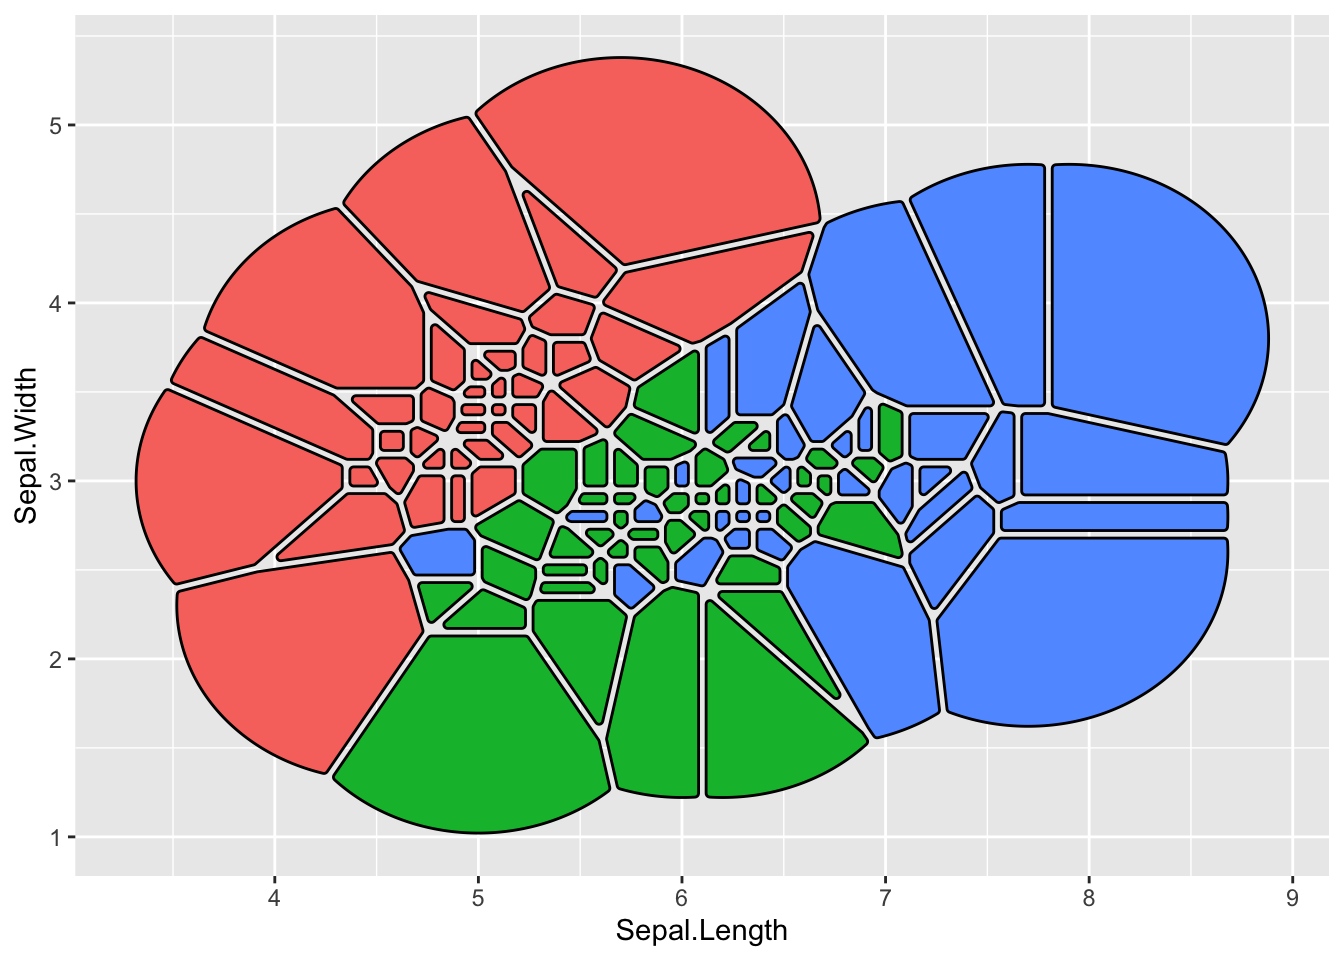
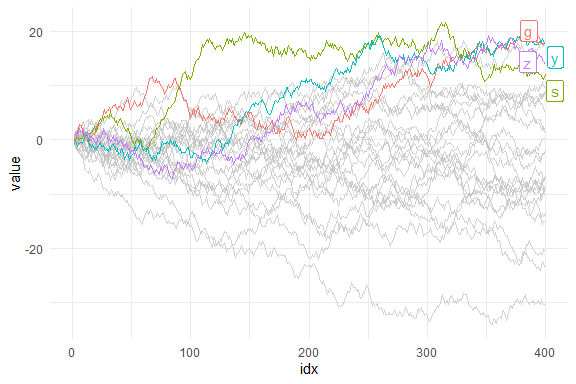

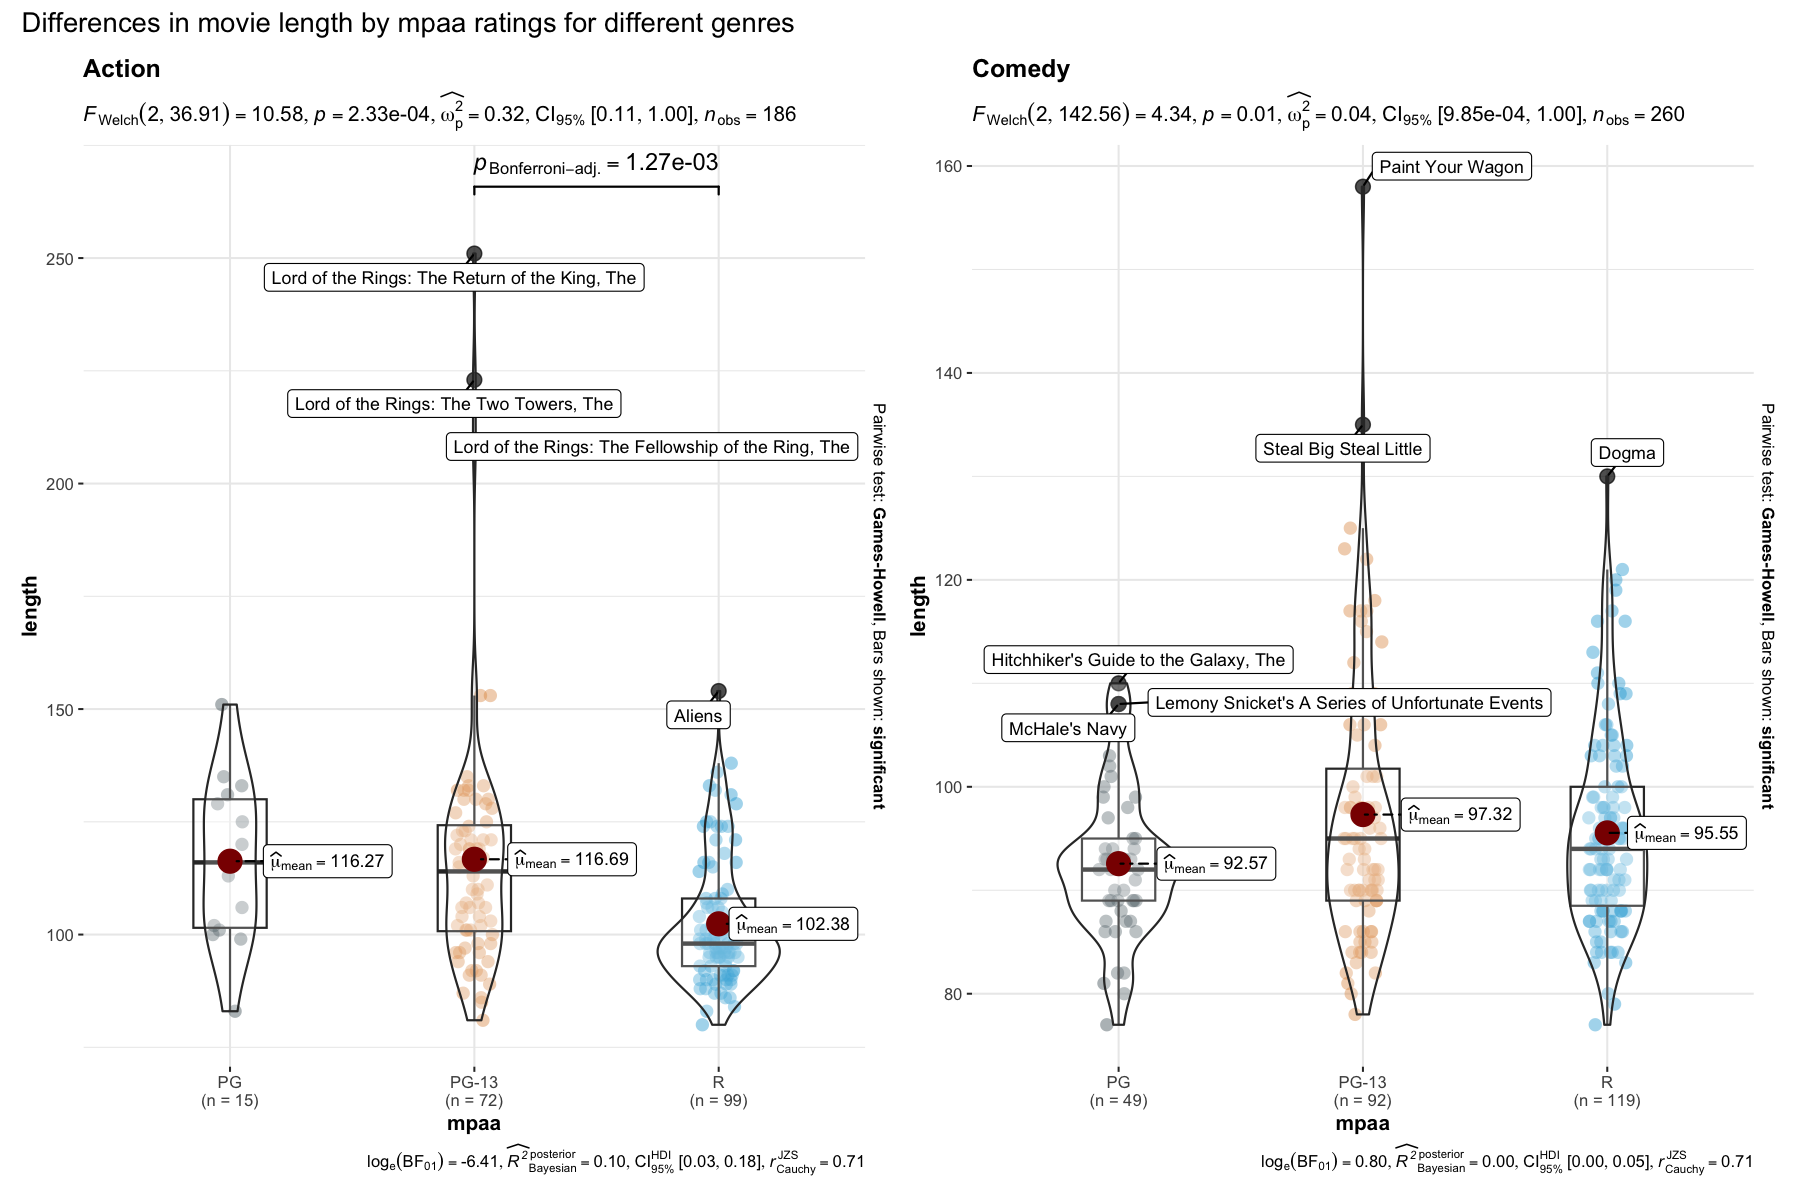
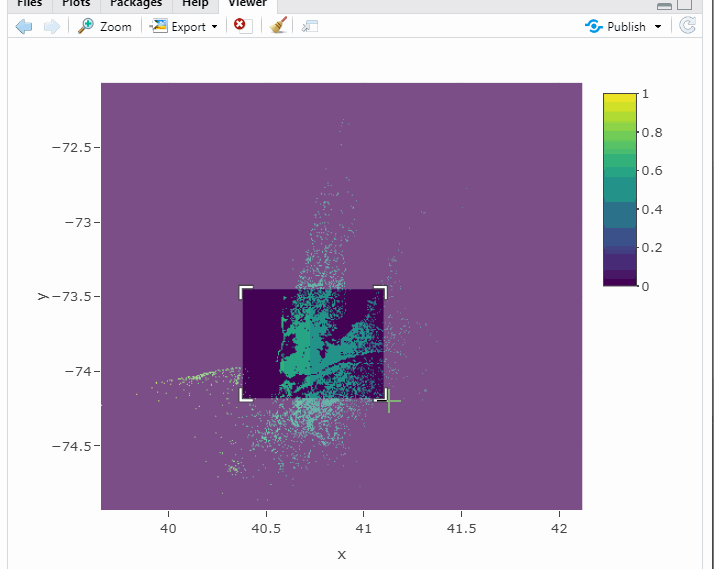
- Saving R Graphics across OSs - Jumping Rivers
- Recent changes in R spatial and how to be ready for them
- Sustainable Transport Planning • rOpenSci: stplanr
- Origin-destination data with stplanr • rOpenSci: stplanr
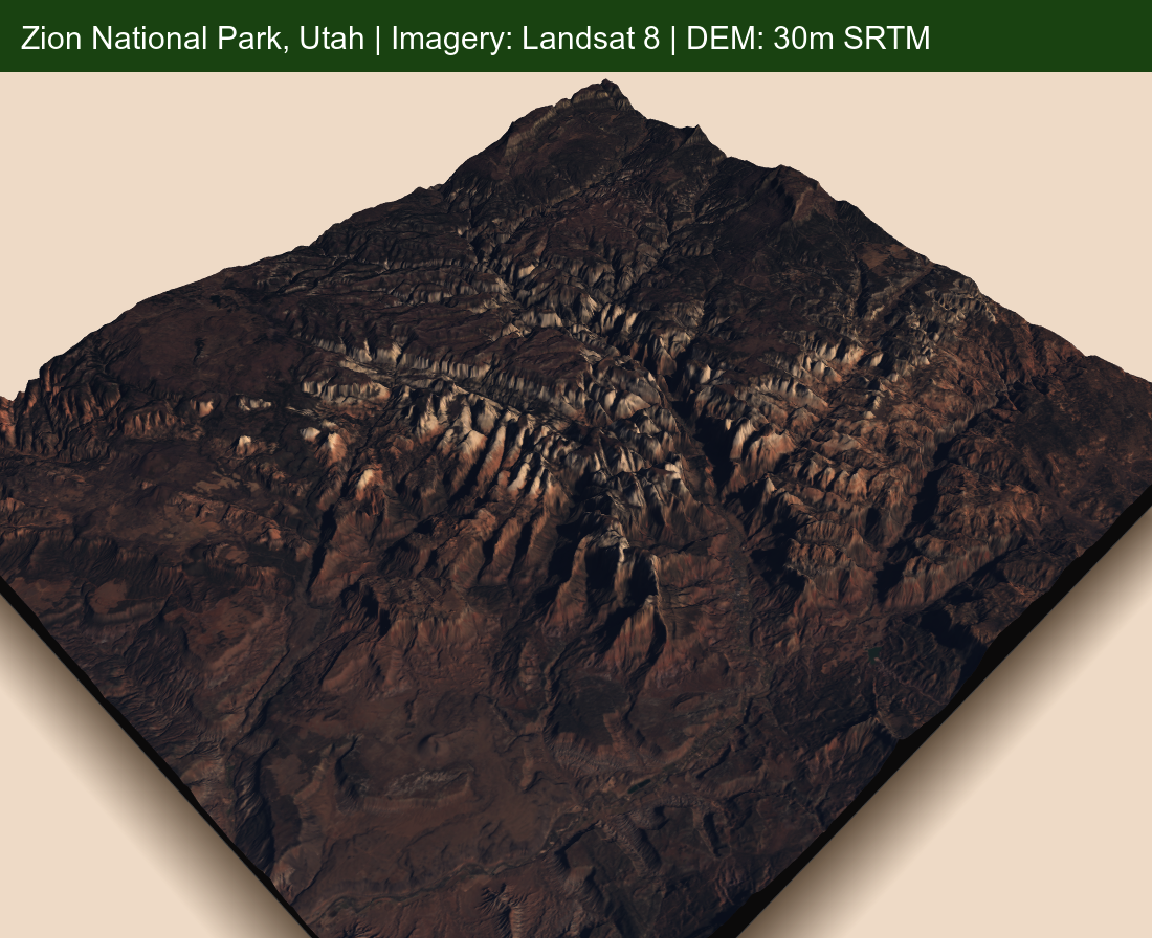
- A Step-by-Step Guide to Making 3D Maps with Satellite Imagery in R
- How to Write an R Package Wrapping a NodeJS Module - Colin Fay
- Tools for Tidy Functional Data • tidyfun
- Introducing Modeltime: Tidy Time Series Forecasting using Tidymodels
- SebKrantz/collapse: Advanced and Fast Data Transformation in R
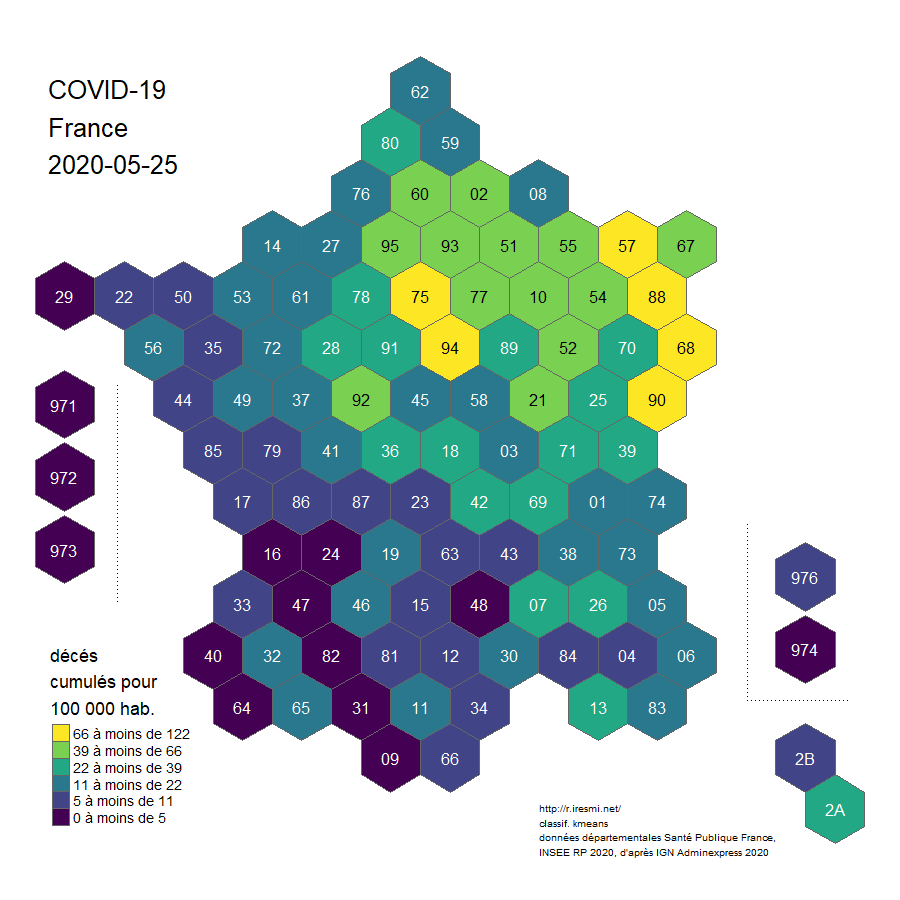
- 多边形到六边形– r.iresmi.net
效率工具
TmTheme Editor:Sublime Text 的主题文件编辑器,也可以用来生成 RStudio 的。
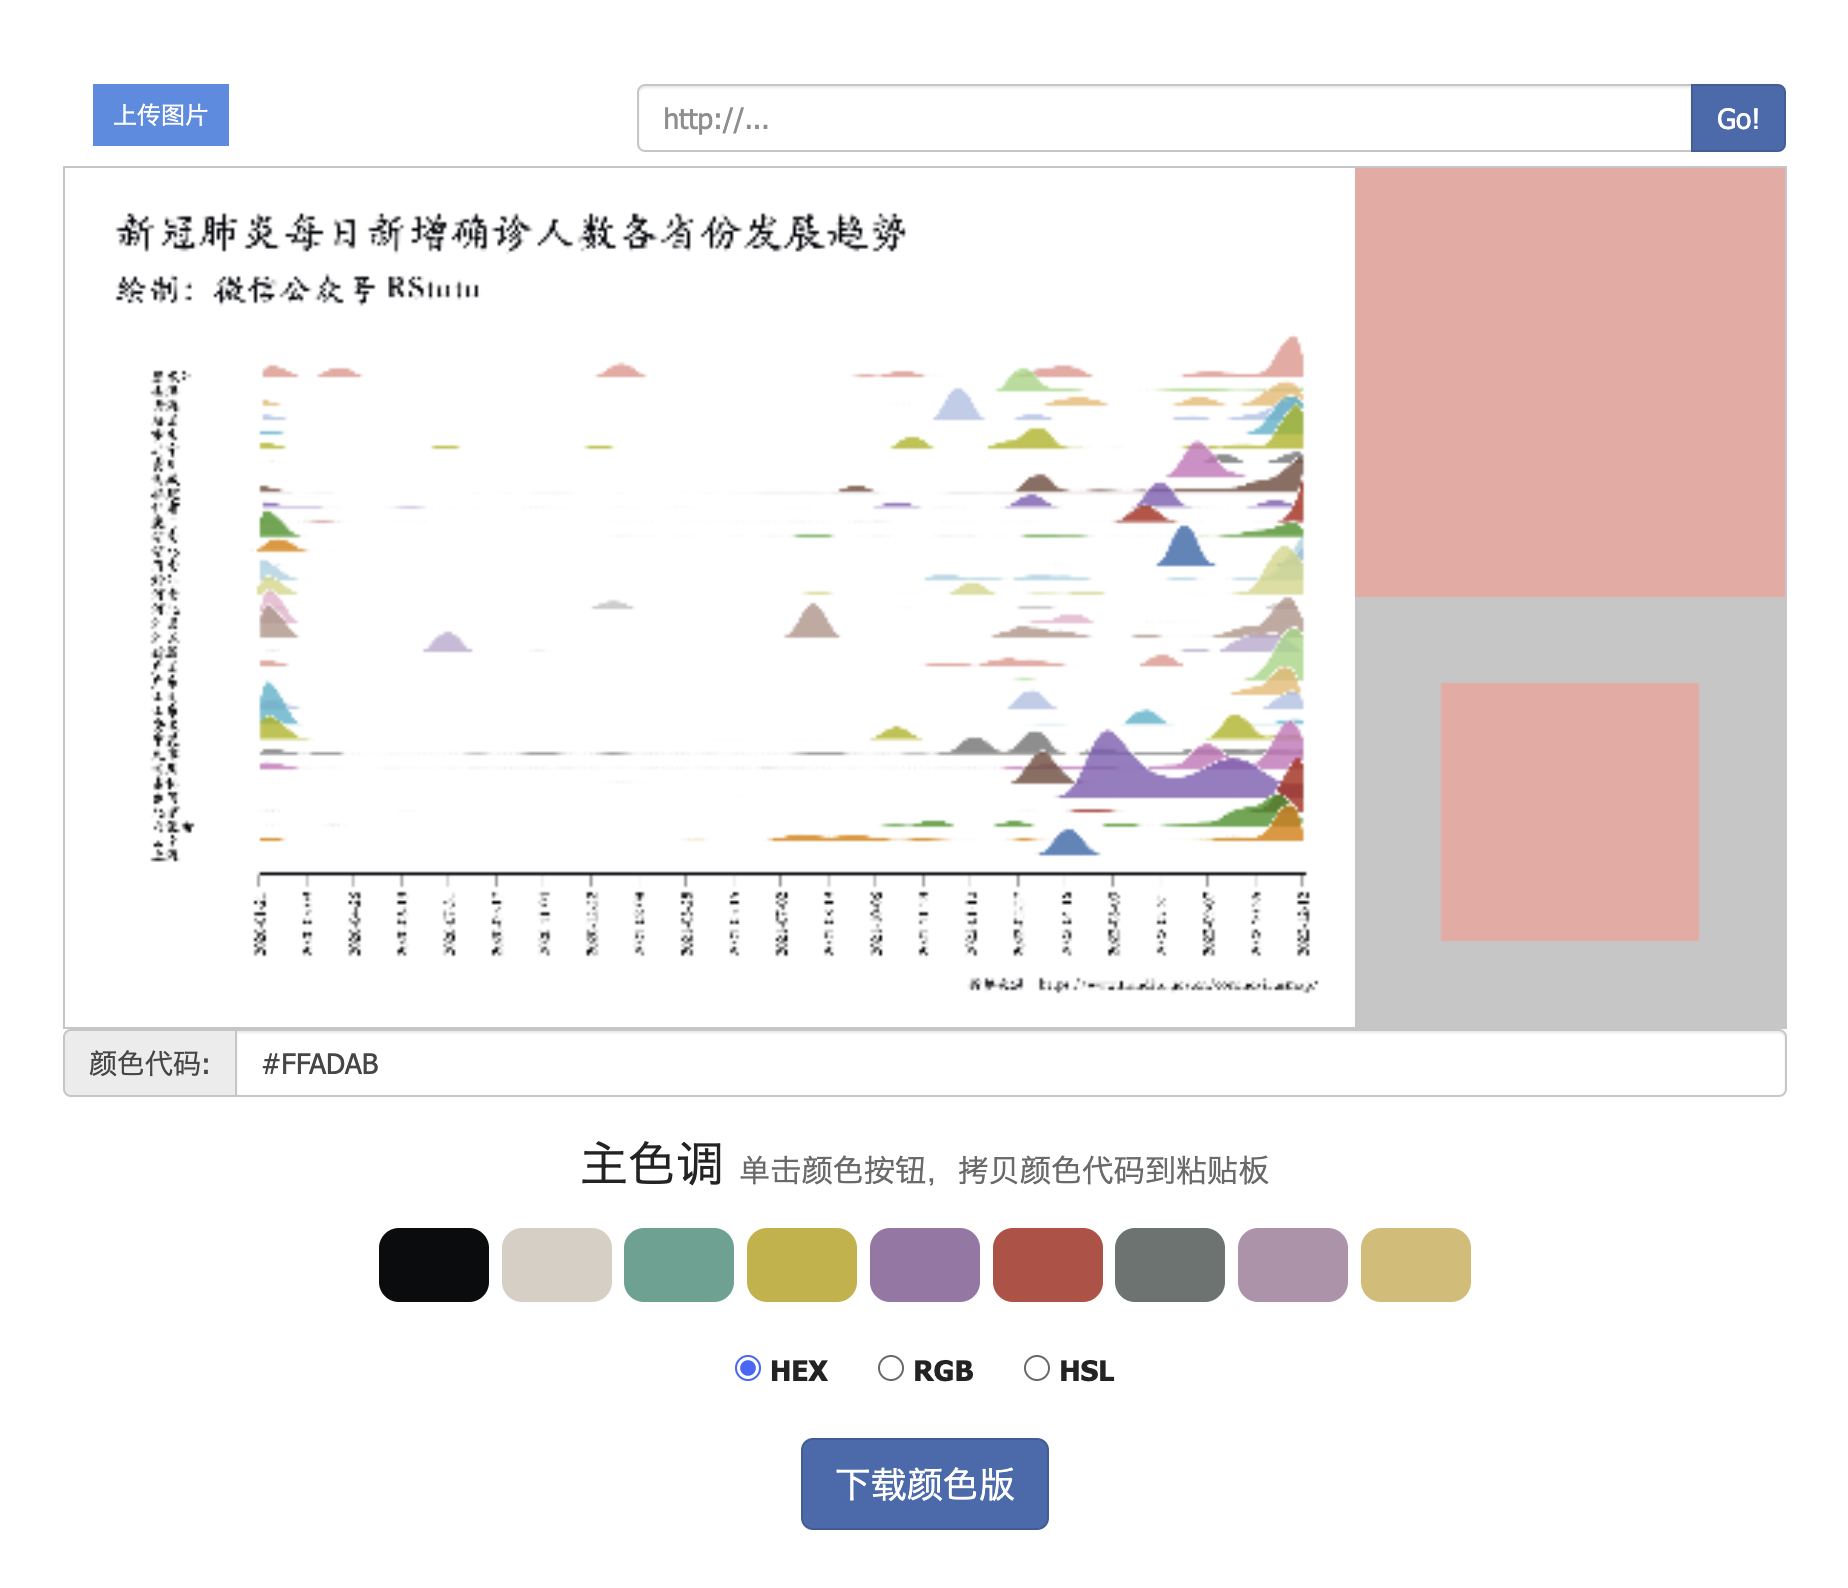
- Baby Map:实时展示每时每刻哪些国家有孩子出生。

- Convert curl to R
- Shields.io: Quality metadata badges for open source projects
- DataGrip破解安装激活最新教程(附破解工具及激活码)
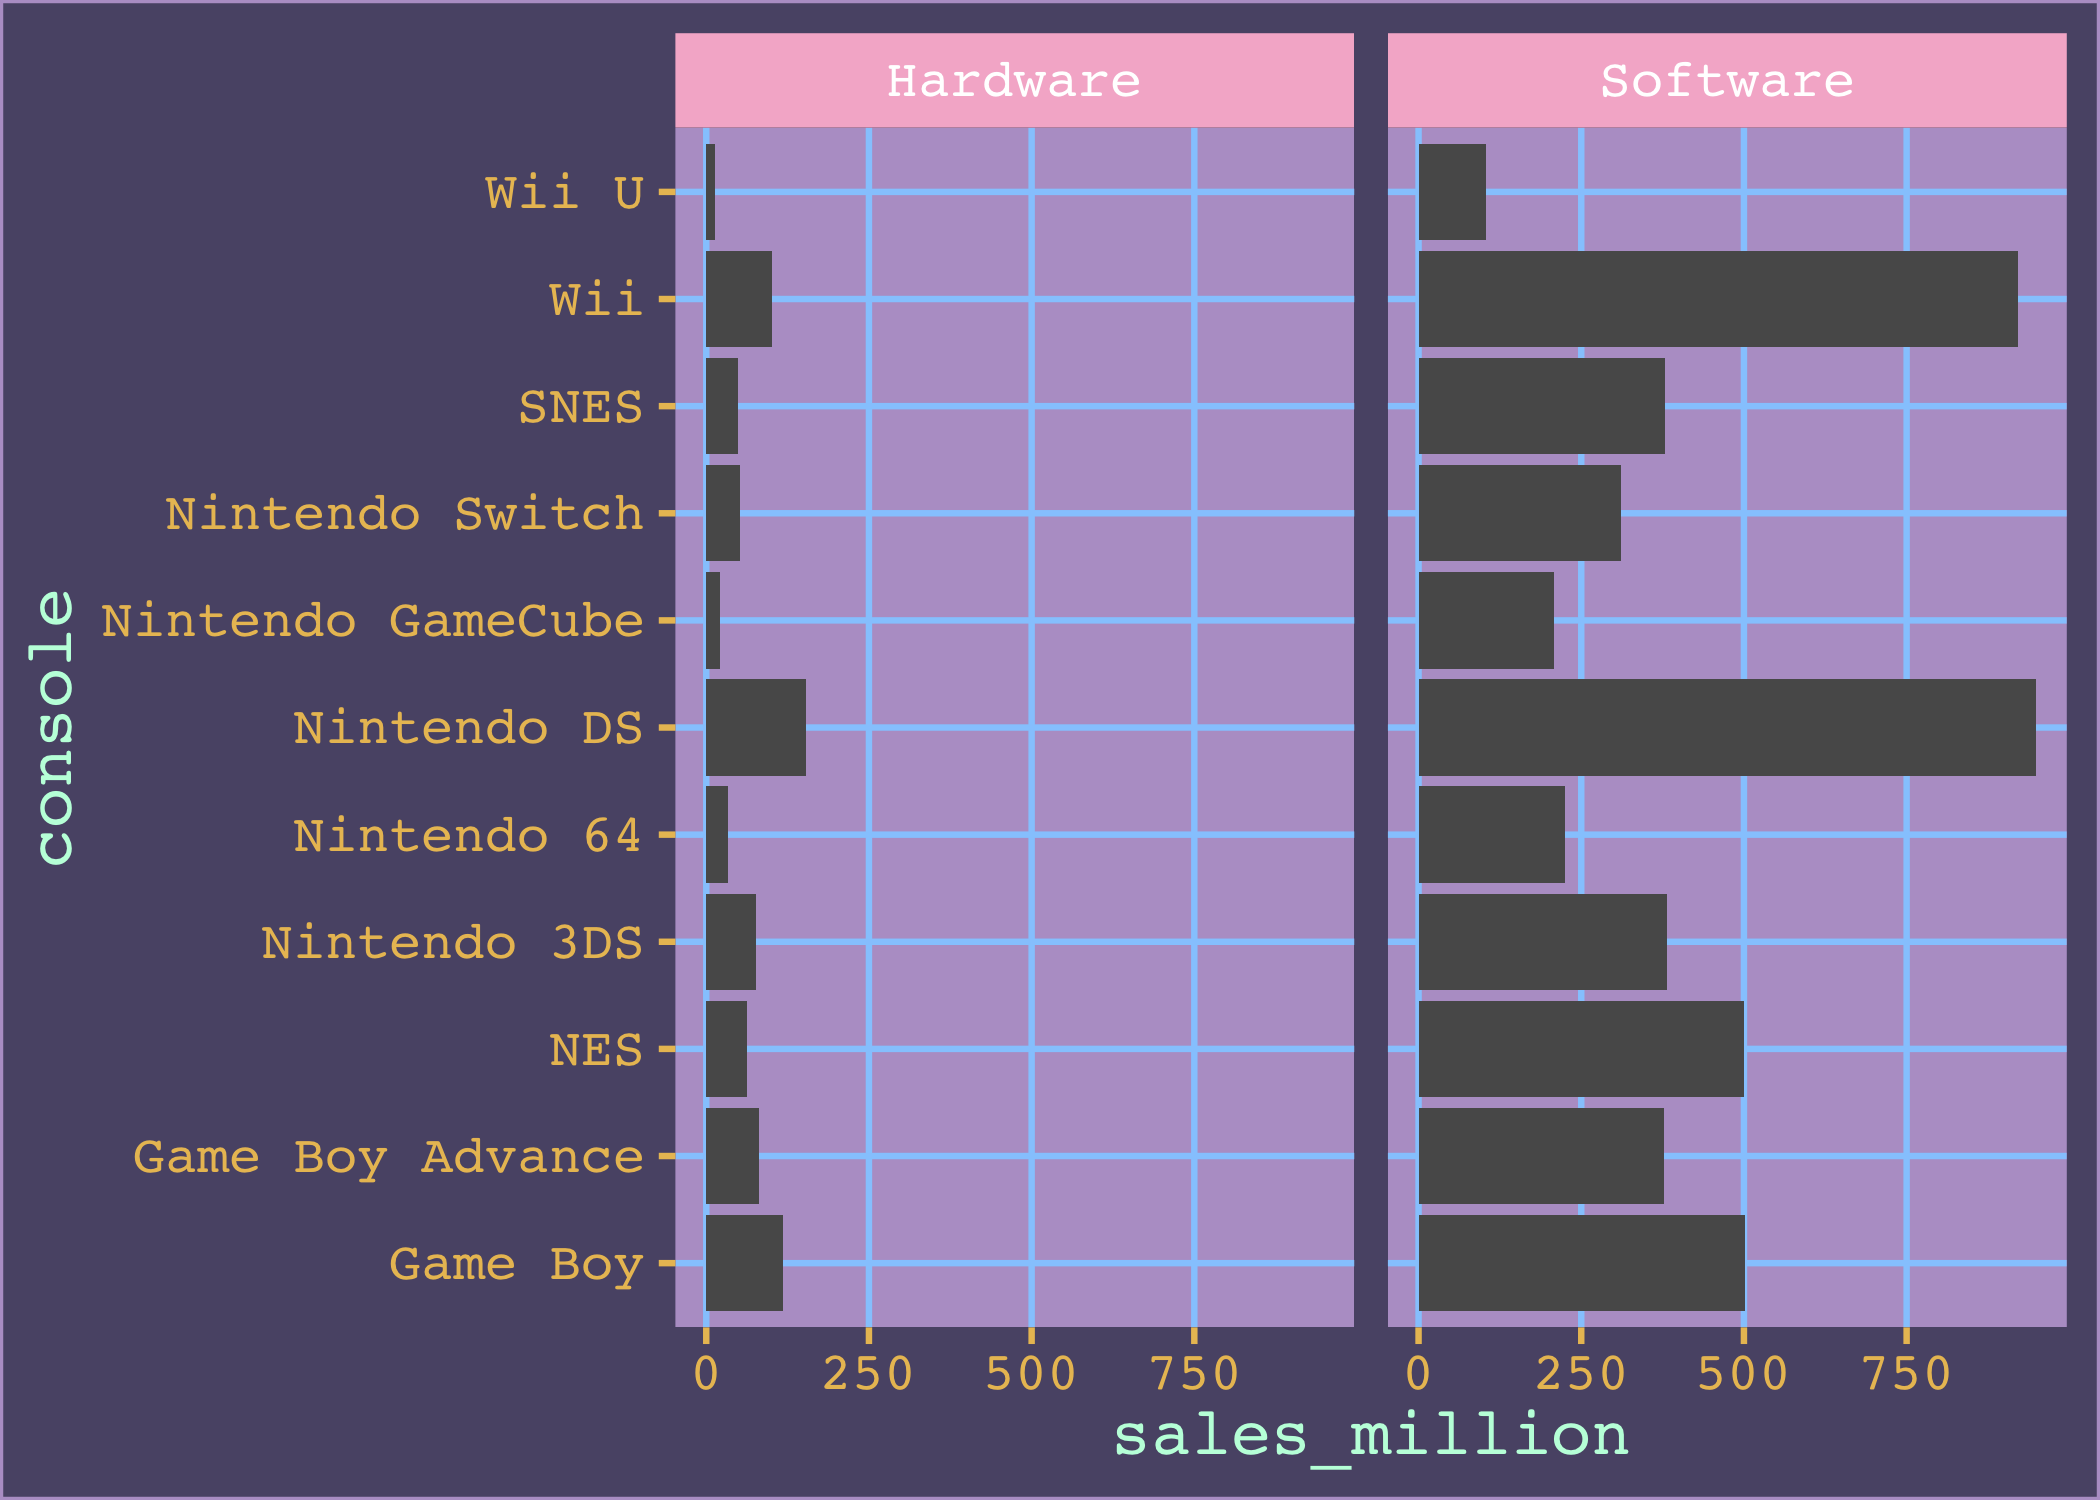
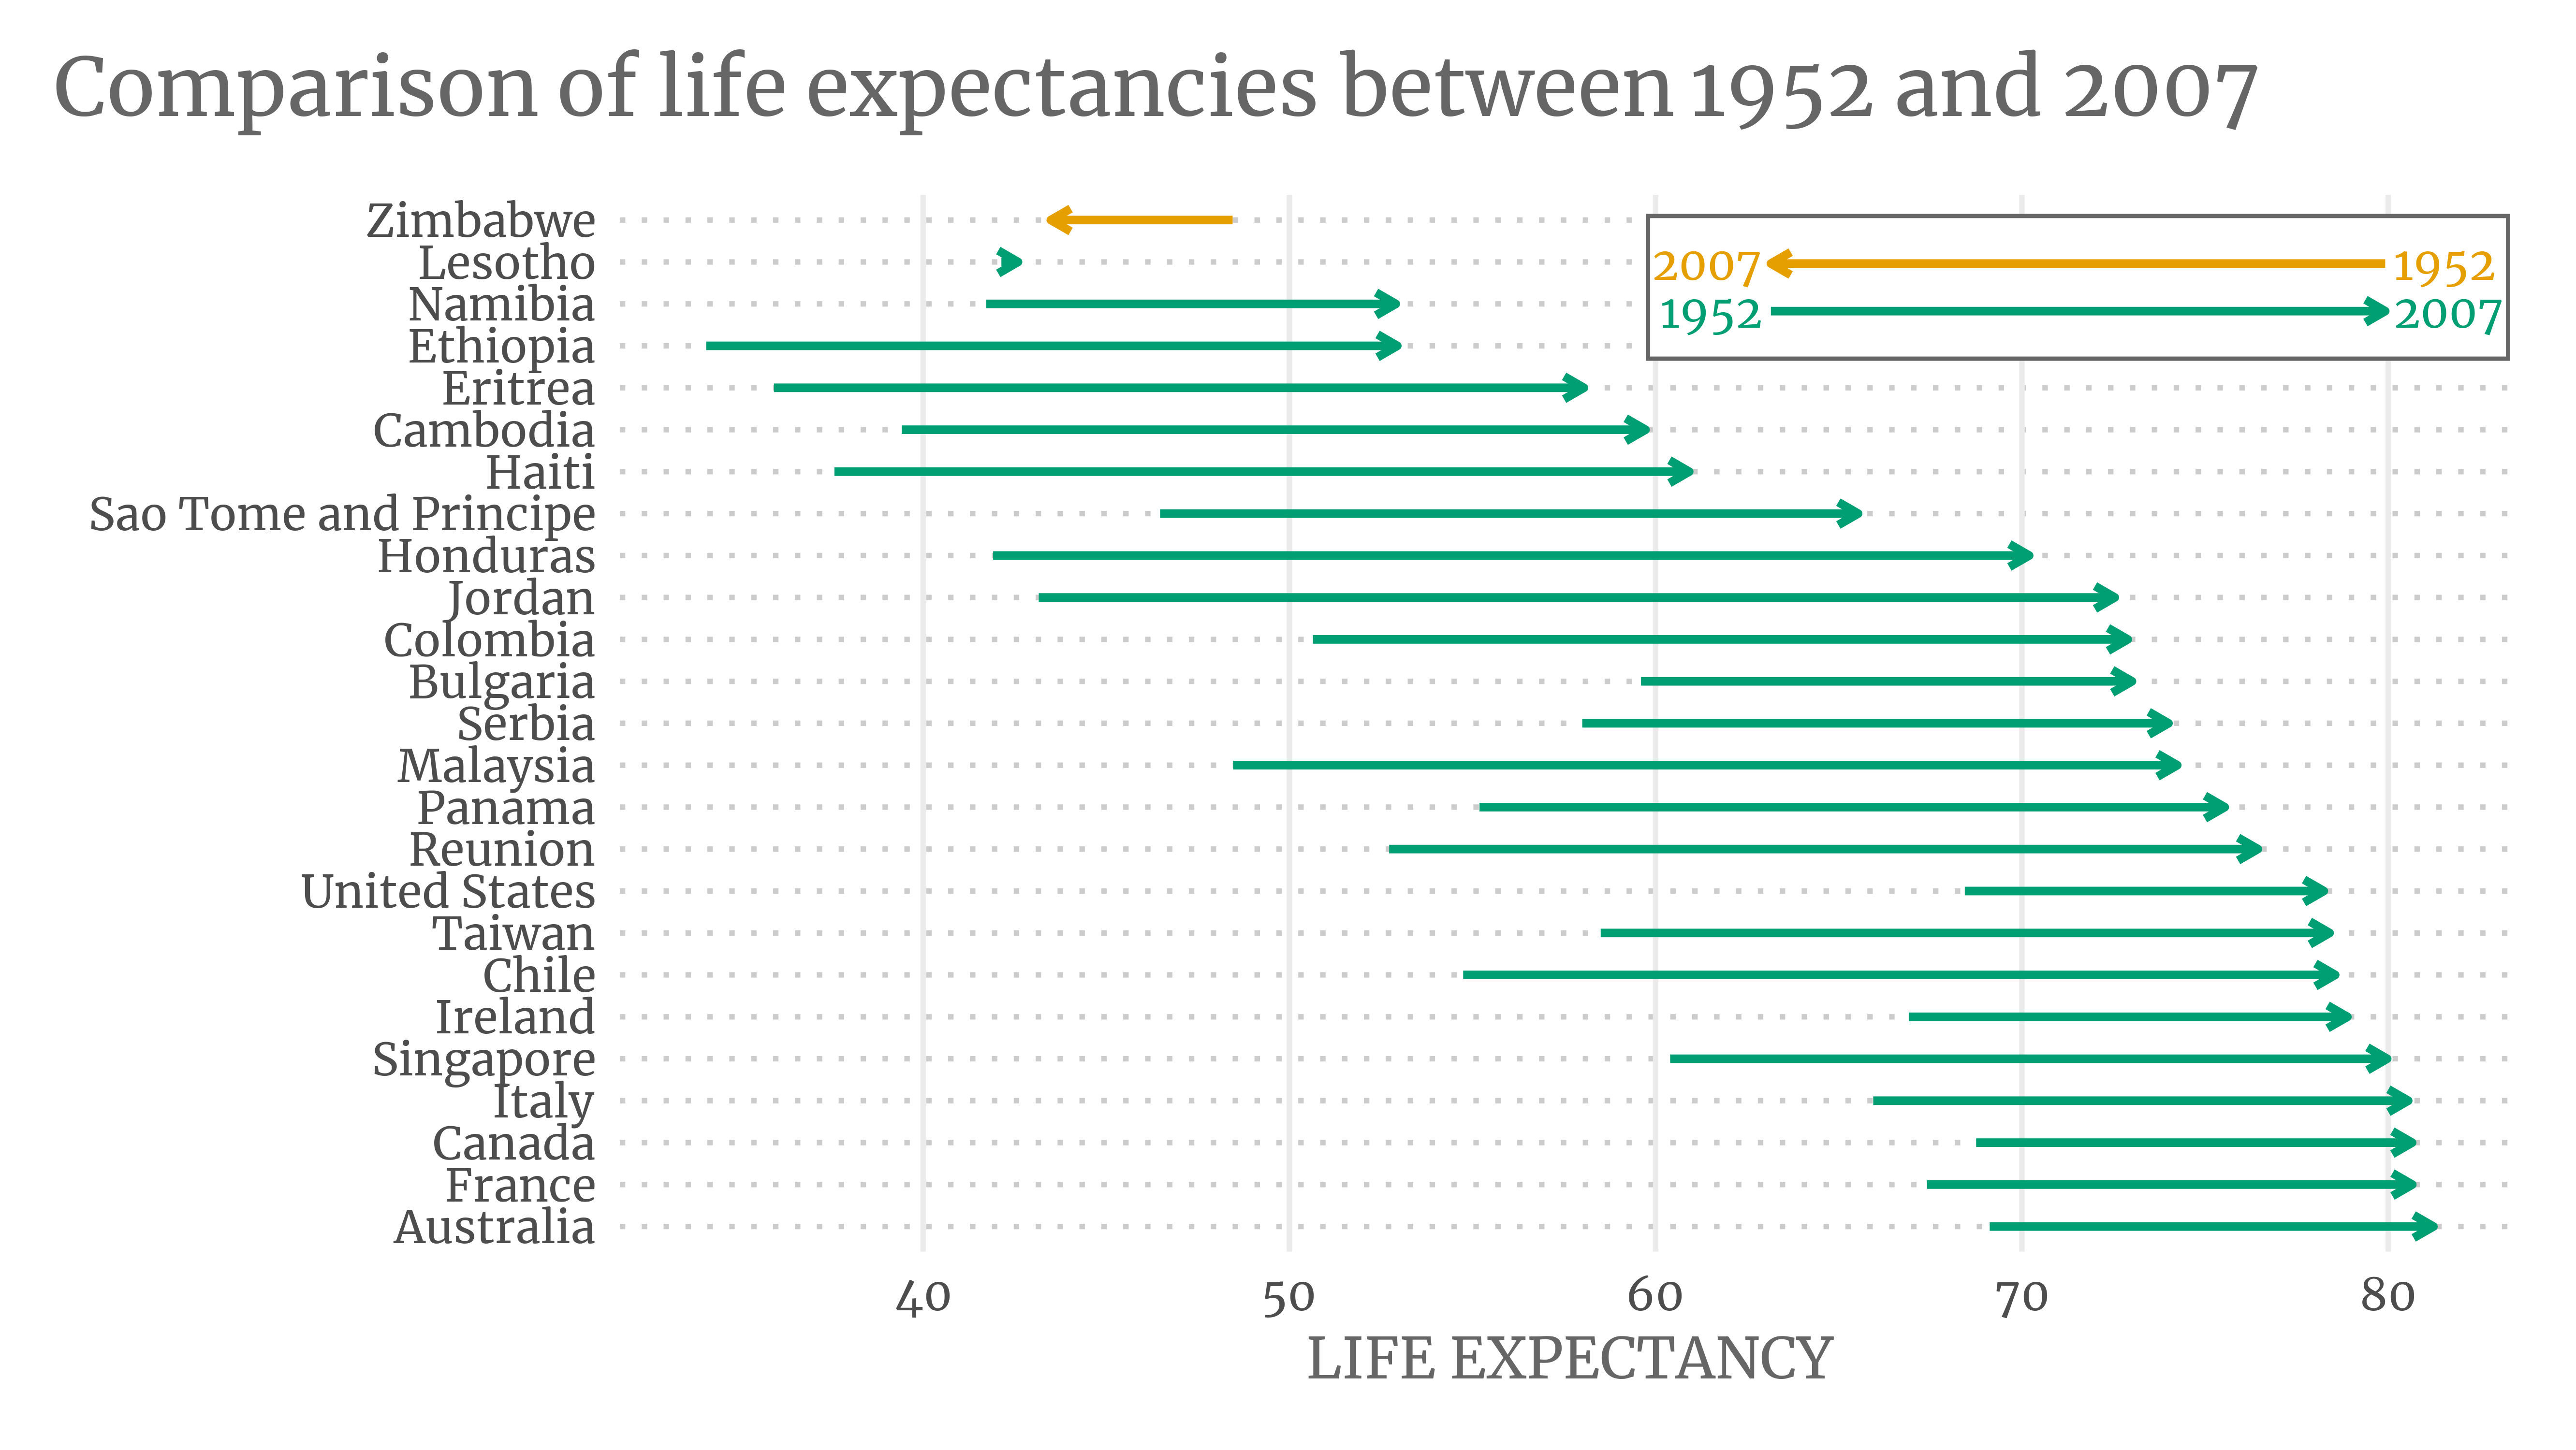
- Alternatives to paired bar charts
- 地理编码 (高德) 地址转经纬度 - 批量工具网
- Convertio — 文件转换器
- Library Genesis+
- PDF Drive - Search and download PDF files for free.
- 提高图片分辨率
- Driving Directions - GraphHopper Maps
- Make A Shortcut for Anything in RStudio with shrtcts
- Worldwide COVID-19 spread visualization with R – AnalyzeCore by Sergey Bryl’ – data is beautiful, data is a story

