library(highcharter)
corrdf %>%
  mutate(v = forcats::fct_reorder(v, corr),
         name = forcats::fct_reorder(name, corr)) %>%
  hchart("heatmap",
         hcaes(x = v, y = name, value = corr),
         dataLabels = list(
           enabled = TRUE,
           format = "{point.corr}<br>{point.label}",
           align = "center",
           style = list(fontFamily = "STSong")
         )) %>%
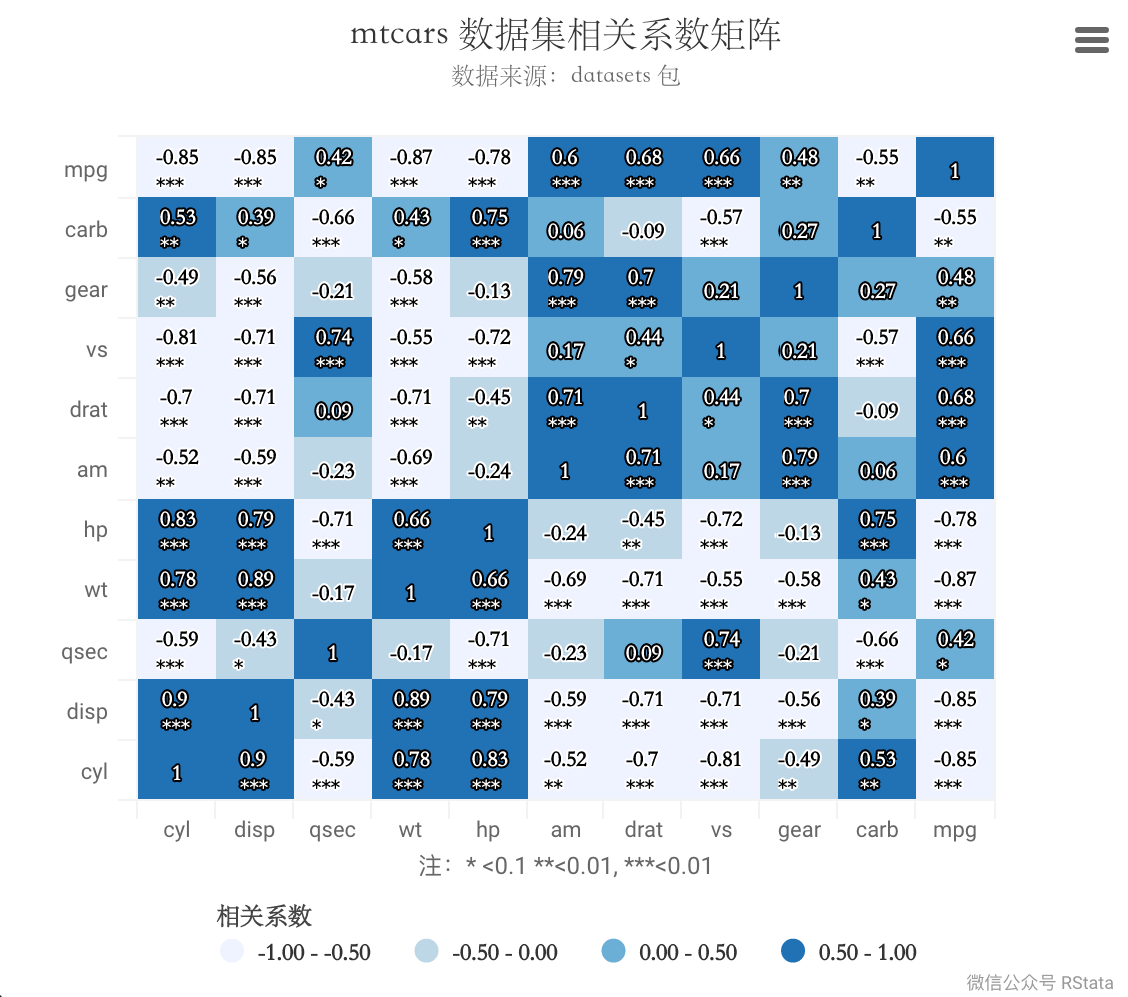
  hc_colorAxis(dataClasses = JS('
      [{from: -1, to: -0.5, color: "#EFF3FF"},
      {from: -0.5, to: 0, color: "#BDD7E7"},
      {from: 0, to: 0.5, color: "#6BAED6"},
      {from: 0.5, to: 1, color: "#2171B5"}]'),
               labels = list(style = list(fontFamily = "STSong"))) %>%
  hc_xAxis(title = list(text = "注:* <0.1 **<0.01, ***<0.01")) %>%
  hc_yAxis(title = list(text = JS('null'))) %>%
  hc_legend(title = list(text = "相关系数",
                         style = list(fontFamily = "STSong")),
            itemStyle = list(fontFamily = "STSong")) %>%
  hc_title(text = "mtcars 数据集相关系数矩阵",
           style = list(fontFamily = "STSong")) %>%
  hc_subtitle(text = "数据来源:datasets 包",
              style = list(fontFamily = "STSong")) %>%
  hc_add_theme(hc_theme_google()) %>%
  hc_credits(enabled = TRUE,
             text = "微信公众号 RStata") %>%
  hc_tooltip(headerFormat = "",
             pointFormat = "<b>{point.v} 和 {point.name}变量的相关性为:</b>{point.corr}",
             borderRadius = 5,
             style = list(fontFamily = "STSong")) %>%
  hc_chart(margin = c(70, 70, 100, 70)) %>%
  hc_exporting(enabled = T)
|
评论