最近发现一个很有意思的 Stata 命令,rankplot,可以用来绘制排名对比图。下面就让我们来一起学习这个命令的用法。
安装
附件中提供了 rankplot 的安装包,使用 net install 即可安装,安装命令类似于:
net install rankplot.pkg, from("rankplot.pkg 所在的文件夹路径") replace
|
运行 help rankplot 即可查看它的帮助文档。
用法
rankplot 可以用于绘制排名比对图用于比较同一个体的两种属性的排名关系,基本用法为:
rankplot varname1 varname2 [if] [in] , id(idvar) [options]
|
例如比较下进口车的重量和长度的关系:
sysuse auto, clear
rankplot weight length if foreign, id(make)
|
| 图表 |
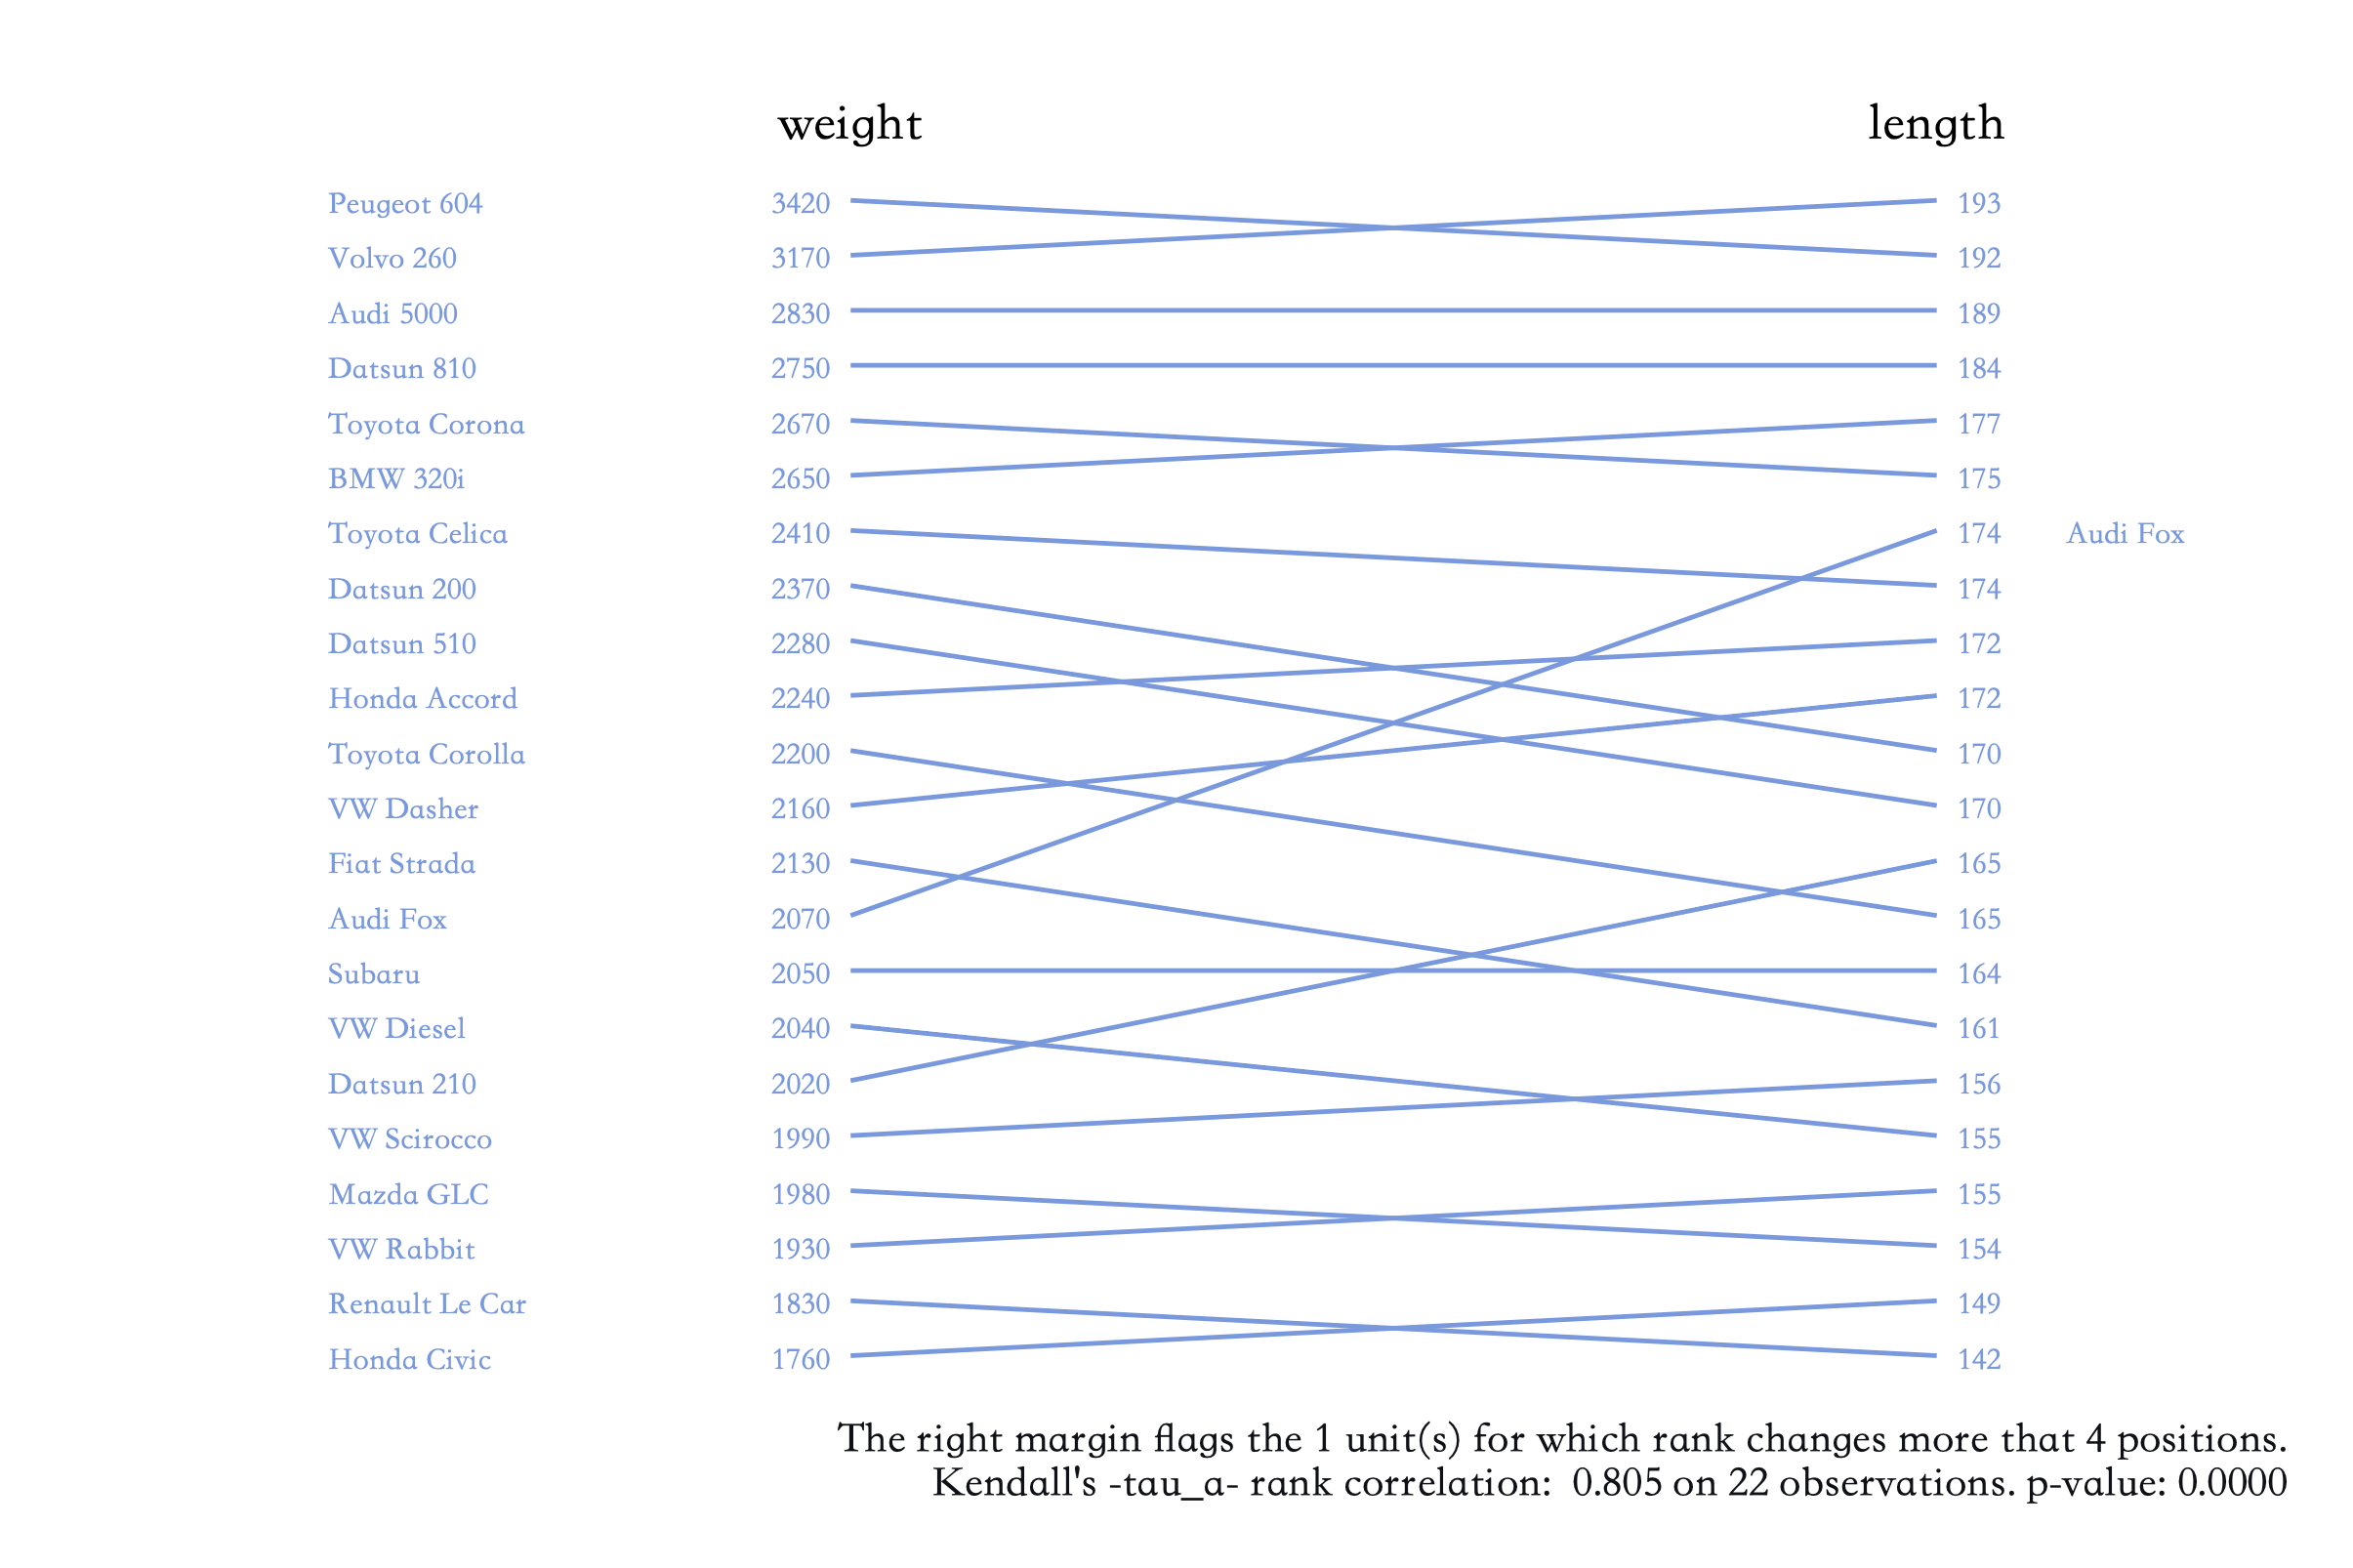 |
右边的 audi fox 表示该款车的排名变化超过了 4 ( bigchange() 选项的默认值)。
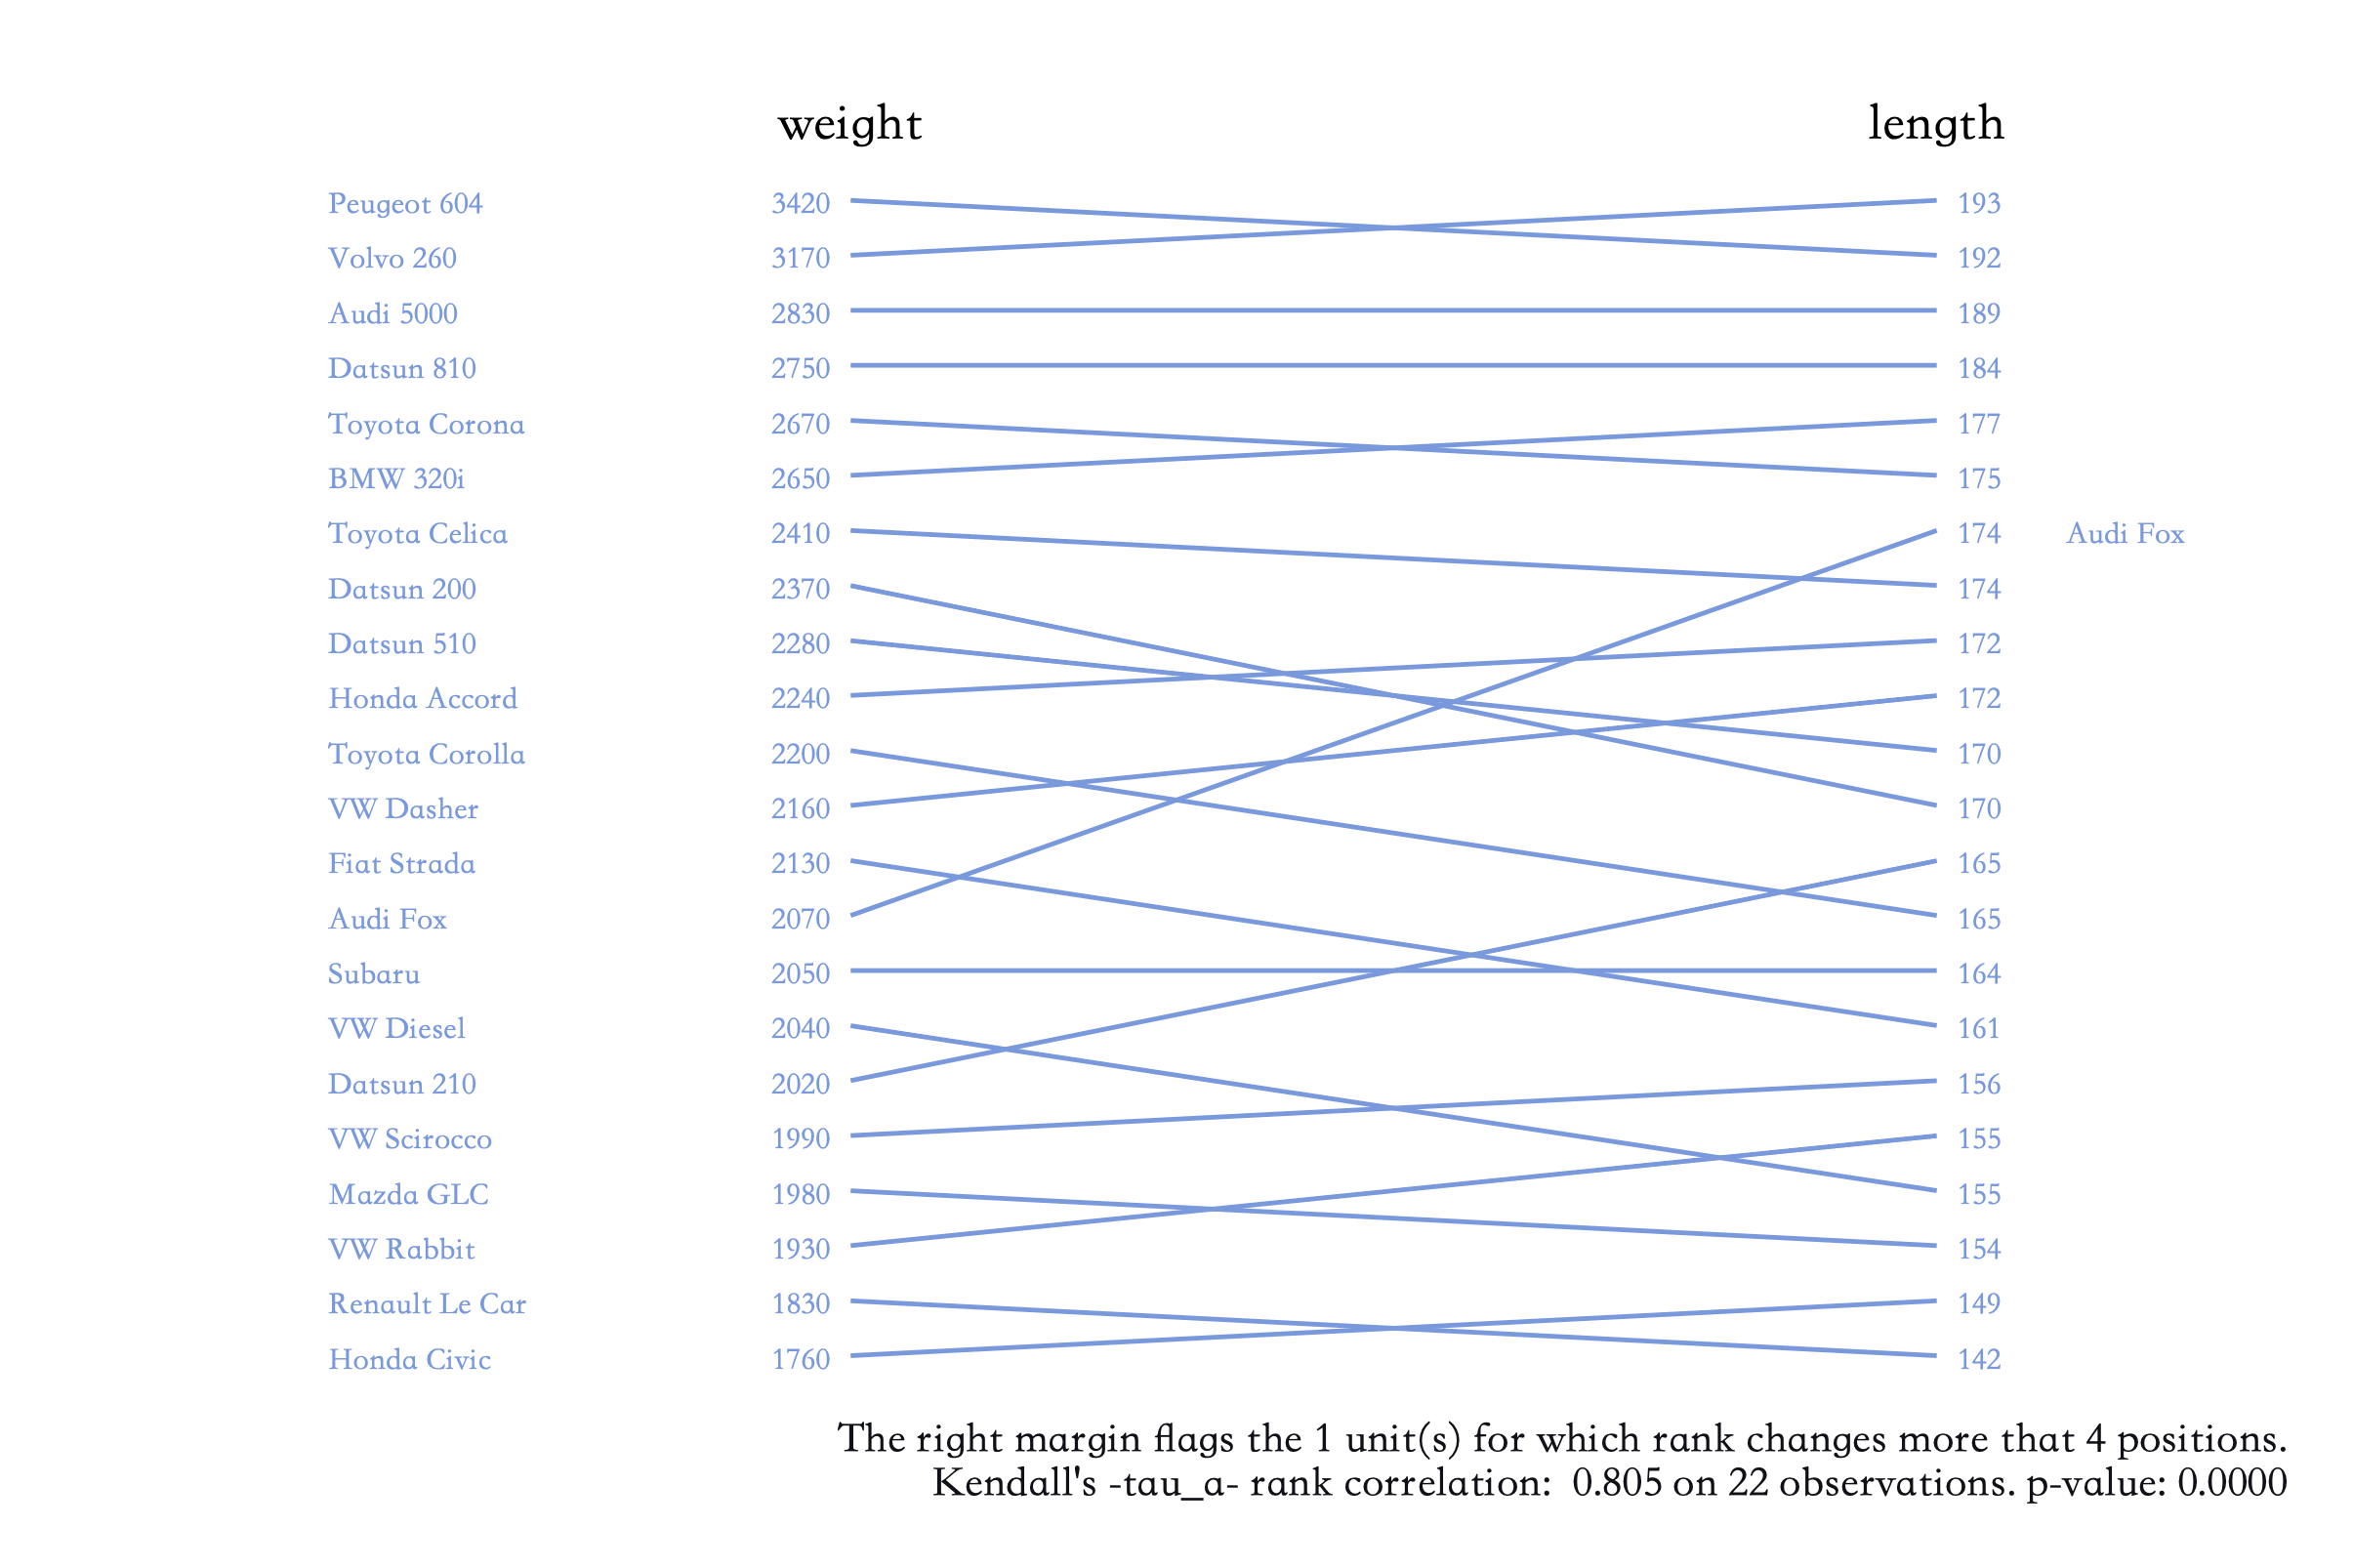
使用 list 选项可以把结果打印出来:
rankplot weight length if foreign, id(make) list

*> Executing Stata's ktau command:

*> ktau weight length

*>   Number of obs =      22
*> Kendall's tau-a =       0.8052
*> Kendall's tau-b =       0.8141
*> Kendall's score =     186
*>     SE of score =      35.393   (corrected for ties)

*> Test of H0: __000000 and __000001 are independent
*>      Prob > |z| =       0.0000  (continuity corrected)

*> The right margin flags the 1 unit(s) for which rank changes more that 4 positions.

*>      +---------------------------------------------------------------------------------+
*>      | make             rank1   weight   Rounded   rank2   length   Rounded   Rank_Chg |
*>      |---------------------------------------------------------------------------------|
*>   1. | Peugeot 604          1    3,420      3420       2      192       192            |
*>   2. | Volvo 260            2    3,170      3170       1      193       193            |
*>   3. | Audi 5000            3    2,830      2830       3      189       189            |
*>   4. | Datsun 810           4    2,750      2750       4      184       184            |
*>   5. | Toyota Corona        5    2,670      2670       6      175       175            |
*>      |---------------------------------------------------------------------------------|
*>   6. | BMW 320i             6    2,650      2650       5      177       177            |
*>   7. | Toyota Celica        7    2,410      2410       8      174       174            |
*>   8. | Datsun 200           8    2,370      2370      12      170       170            |
*>   9. | Datsun 510           9    2,280      2280      11      170       170            |
*>  10. | Honda Accord        10    2,240      2240      10      172       172            |
*>      |---------------------------------------------------------------------------------|
*>  11. | Toyota Corolla      11    2,200      2200      13      165       165            |
*>  12. | VW Dasher           12    2,160      2160       9      172       172            |
*>  13. | Fiat Strada         13    2,130      2130      16      161       161            |
*>  14. | Audi Fox            14    2,070      2070       7      174       174   Audi Fox |
*>  15. | Subaru              15    2,050      2050      15      164       164            |
*>      |---------------------------------------------------------------------------------|
*>  16. | VW Diesel           16    2,040      2040      18      155       155            |
*>  17. | Datsun 210          17    2,020      2020      14      165       165            |
*>  18. | VW Scirocco         18    1,990      1990      17      156       156            |
*>  19. | Mazda GLC           19    1,980      1980      20      154       154            |
*>  20. | VW Rabbit           20    1,930      1930      19      155       155            |
*>      |---------------------------------------------------------------------------------|
*>  21. | Renault Le Car      21    1,830      1830      22      142       142            |
*>  22. | Honda Civic         22    1,760      1760      21      149       149            |
*>      +---------------------------------------------------------------------------------+
|
| 图表 |
 |
另外运行 ret list 可以看到这些结果也被存储到了返回值中:
ret list

*> scalars:
*>                   r(N) =  74
*>           r(bigchange) =  4
*>            r(nchgrank) =  1
*>               r(tau_a) =  .8051948051948052
*>               r(tau_b) =  .8140531004136461
*>               r(score) =  186
*>            r(se_score) =  35.39303132915668
*>                   r(p) =  1.72266046983e-07

*> matrices:
*>                r(list) :  22 x 6
|
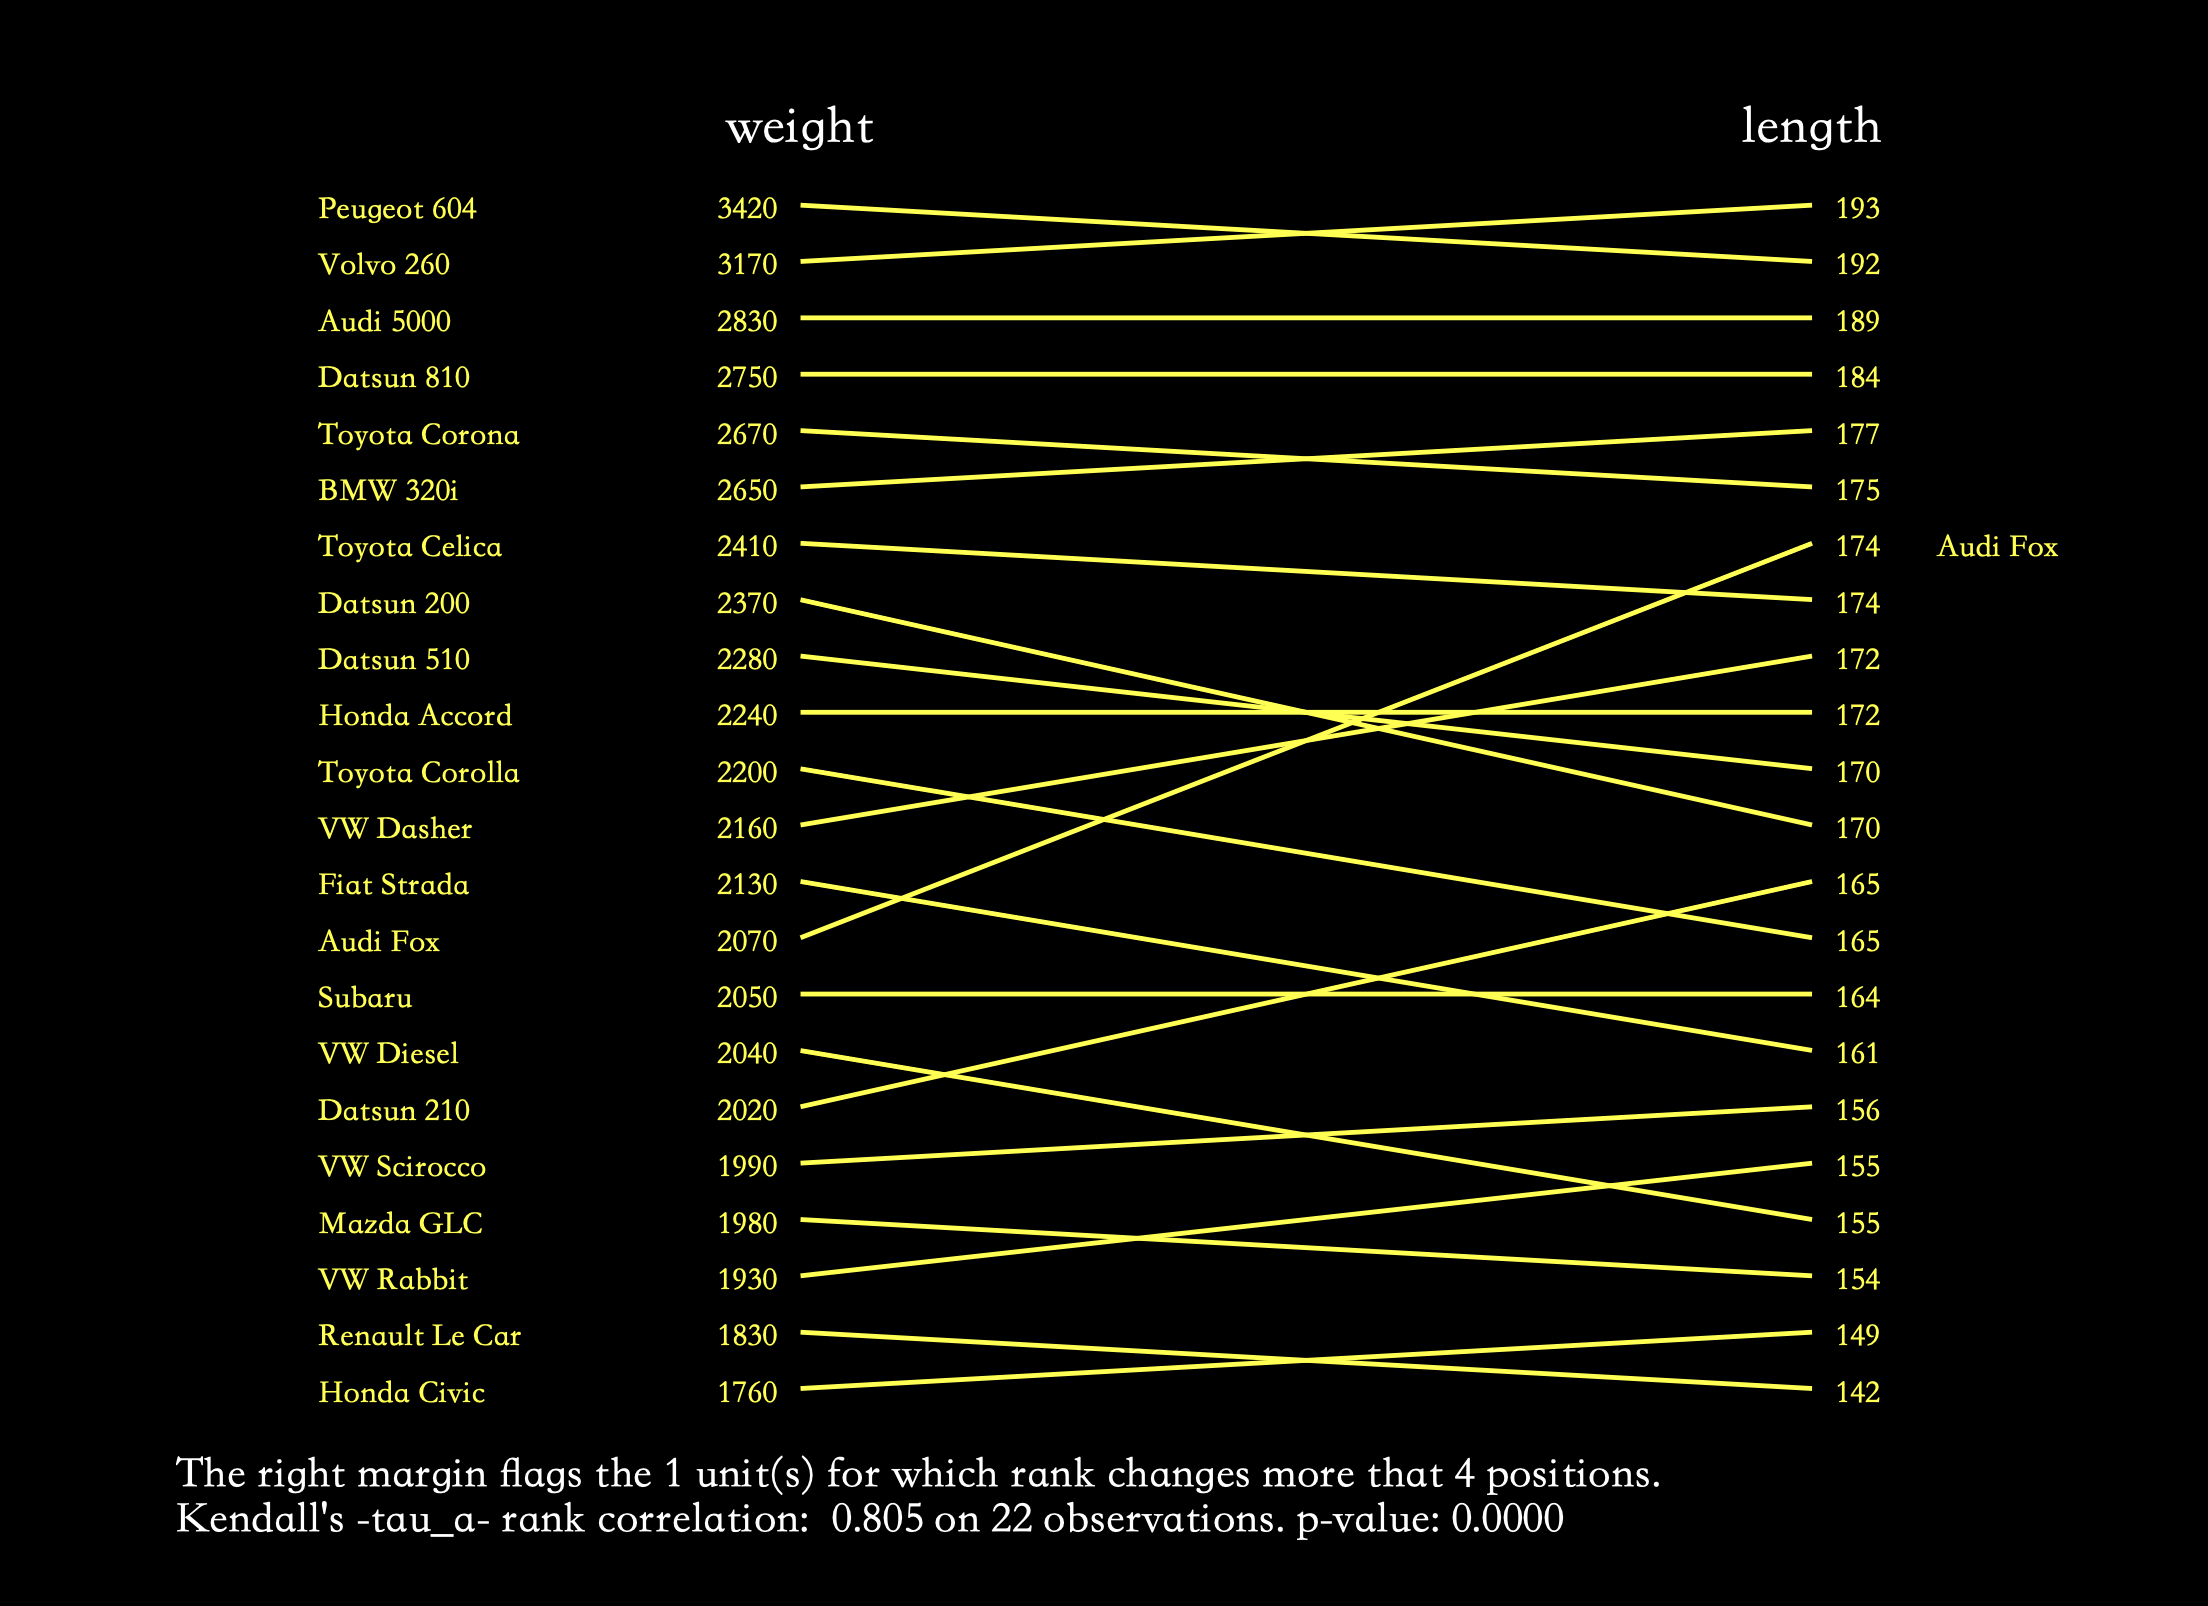
使用 scheme() 选项可以设置绘图主题:
rankplot weight length if foreign, id(make) scheme(s1rcolor)
|
| 图表 |
 |
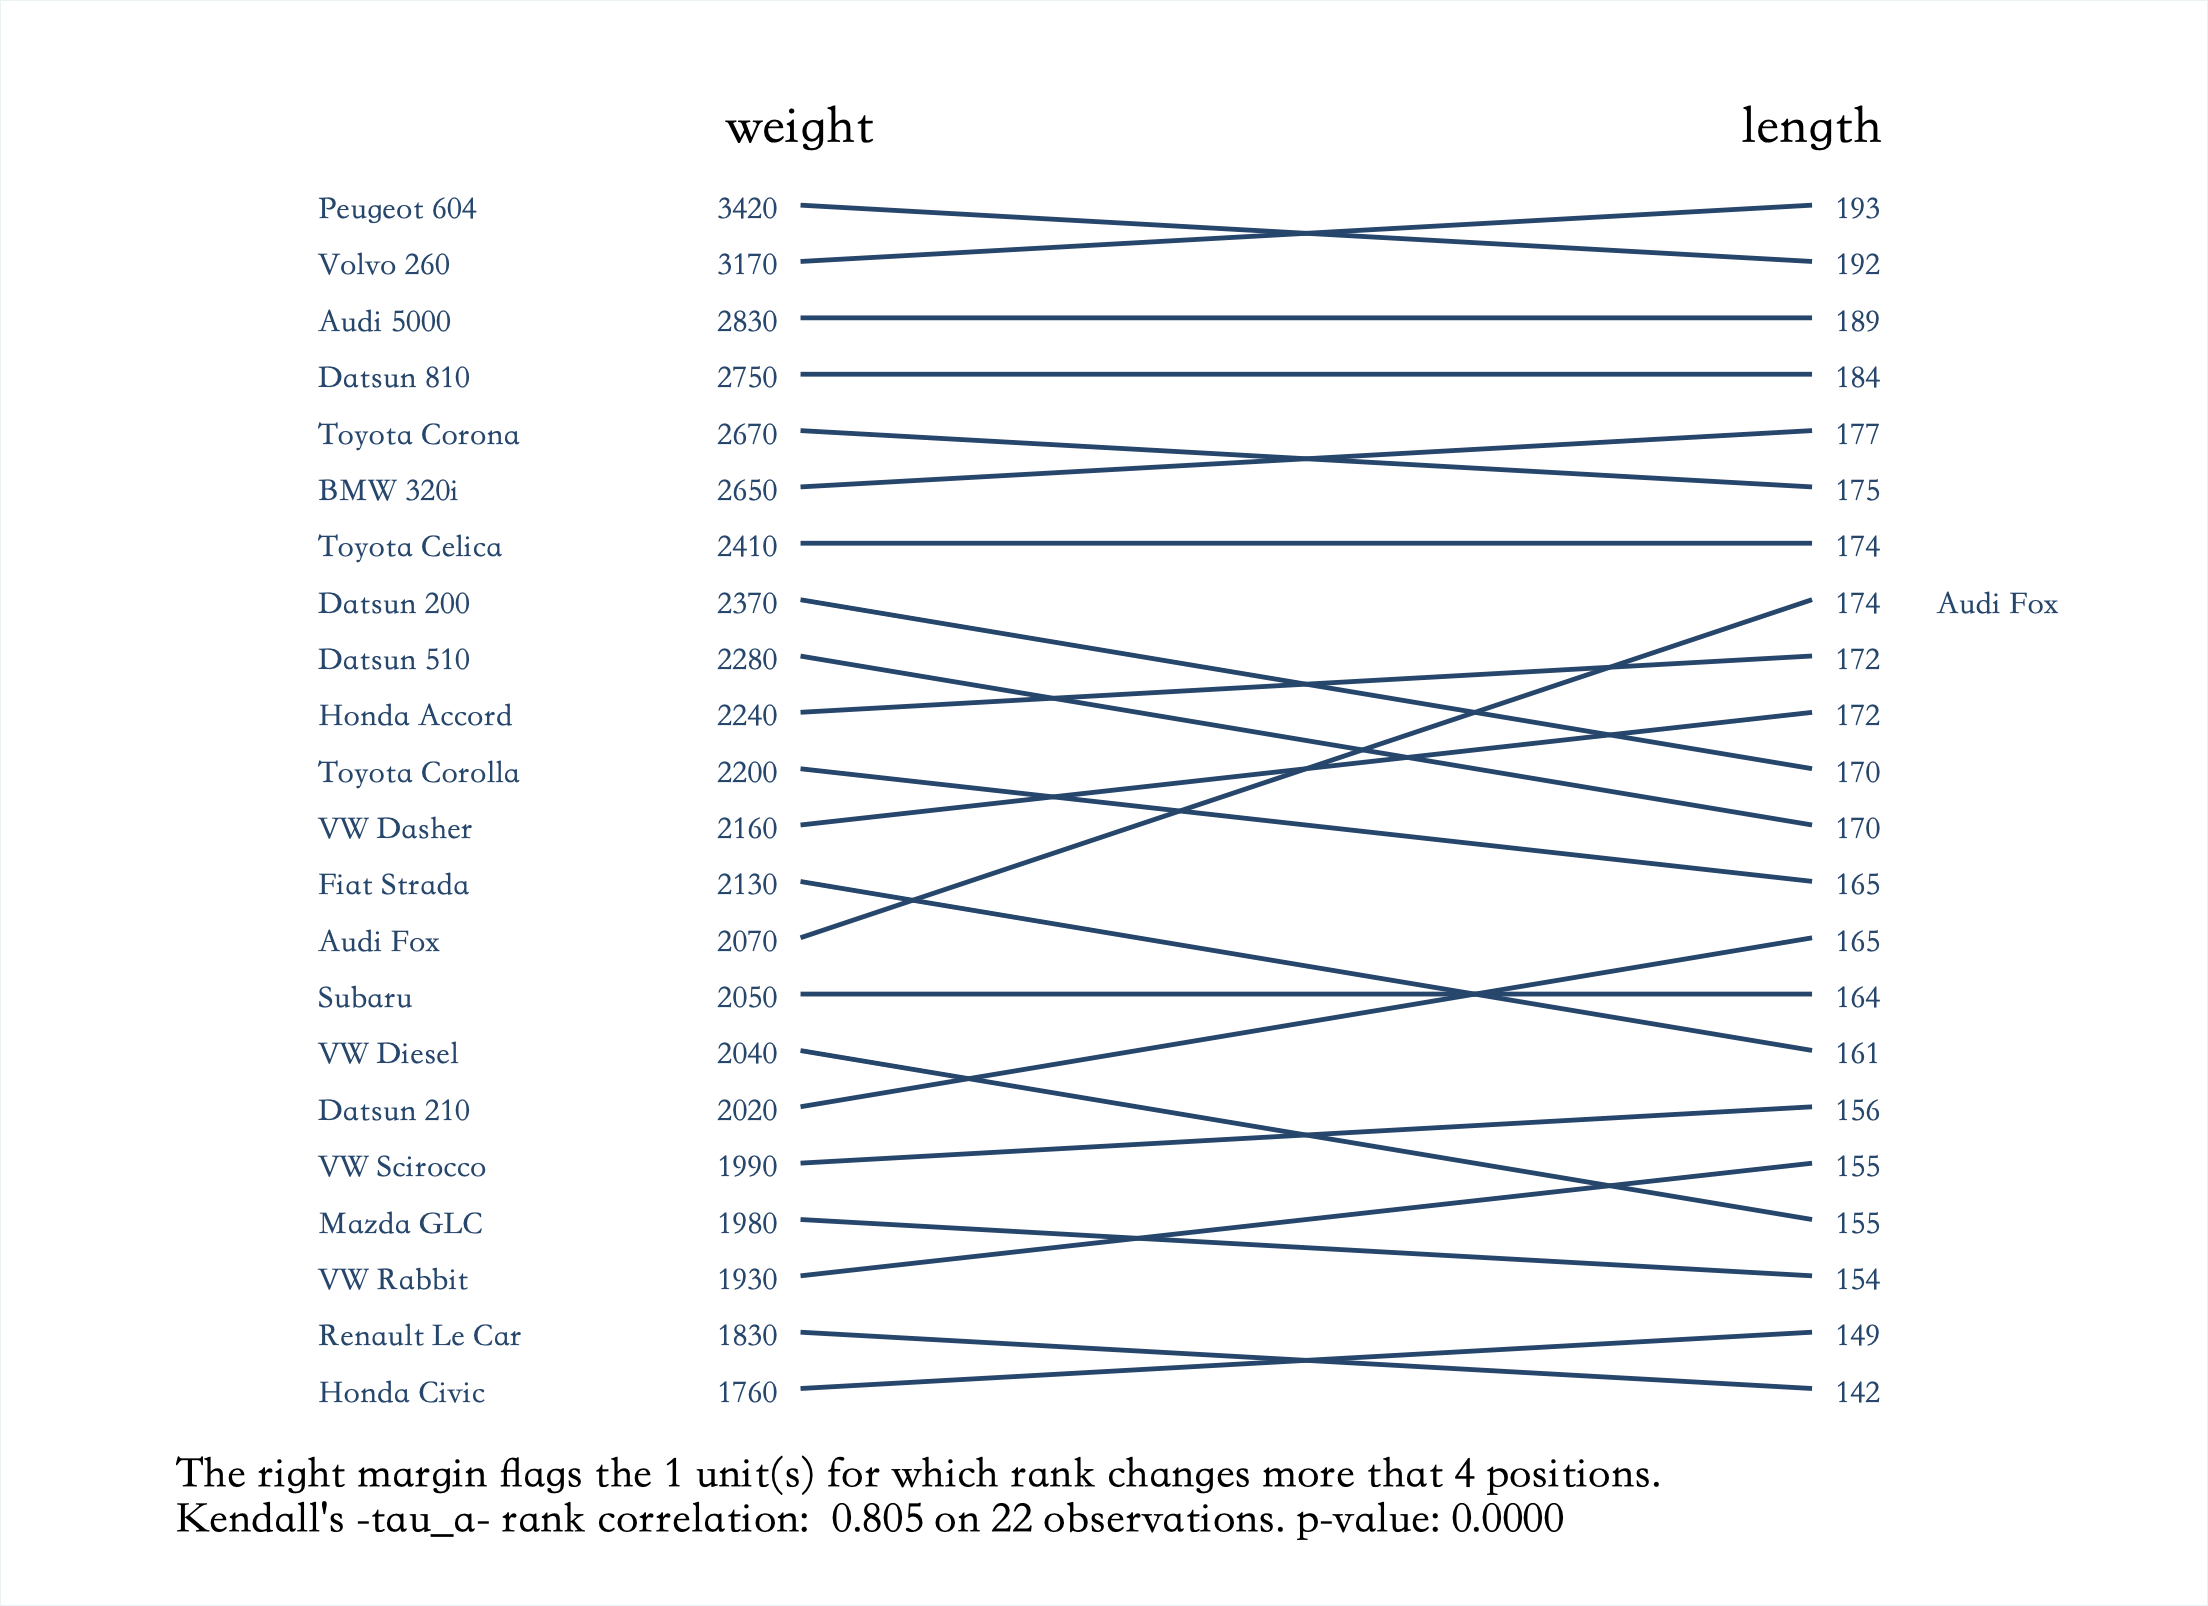
grcolor() 选项可以用于设置背景色,例如 s2color 主题的图表背景色是蓝色的,可以使用 grcolor() 设置为白色:
rankplot weight length if foreign, id(make) scheme(s2color) grcolor(white)
|
| 图表 |
 |
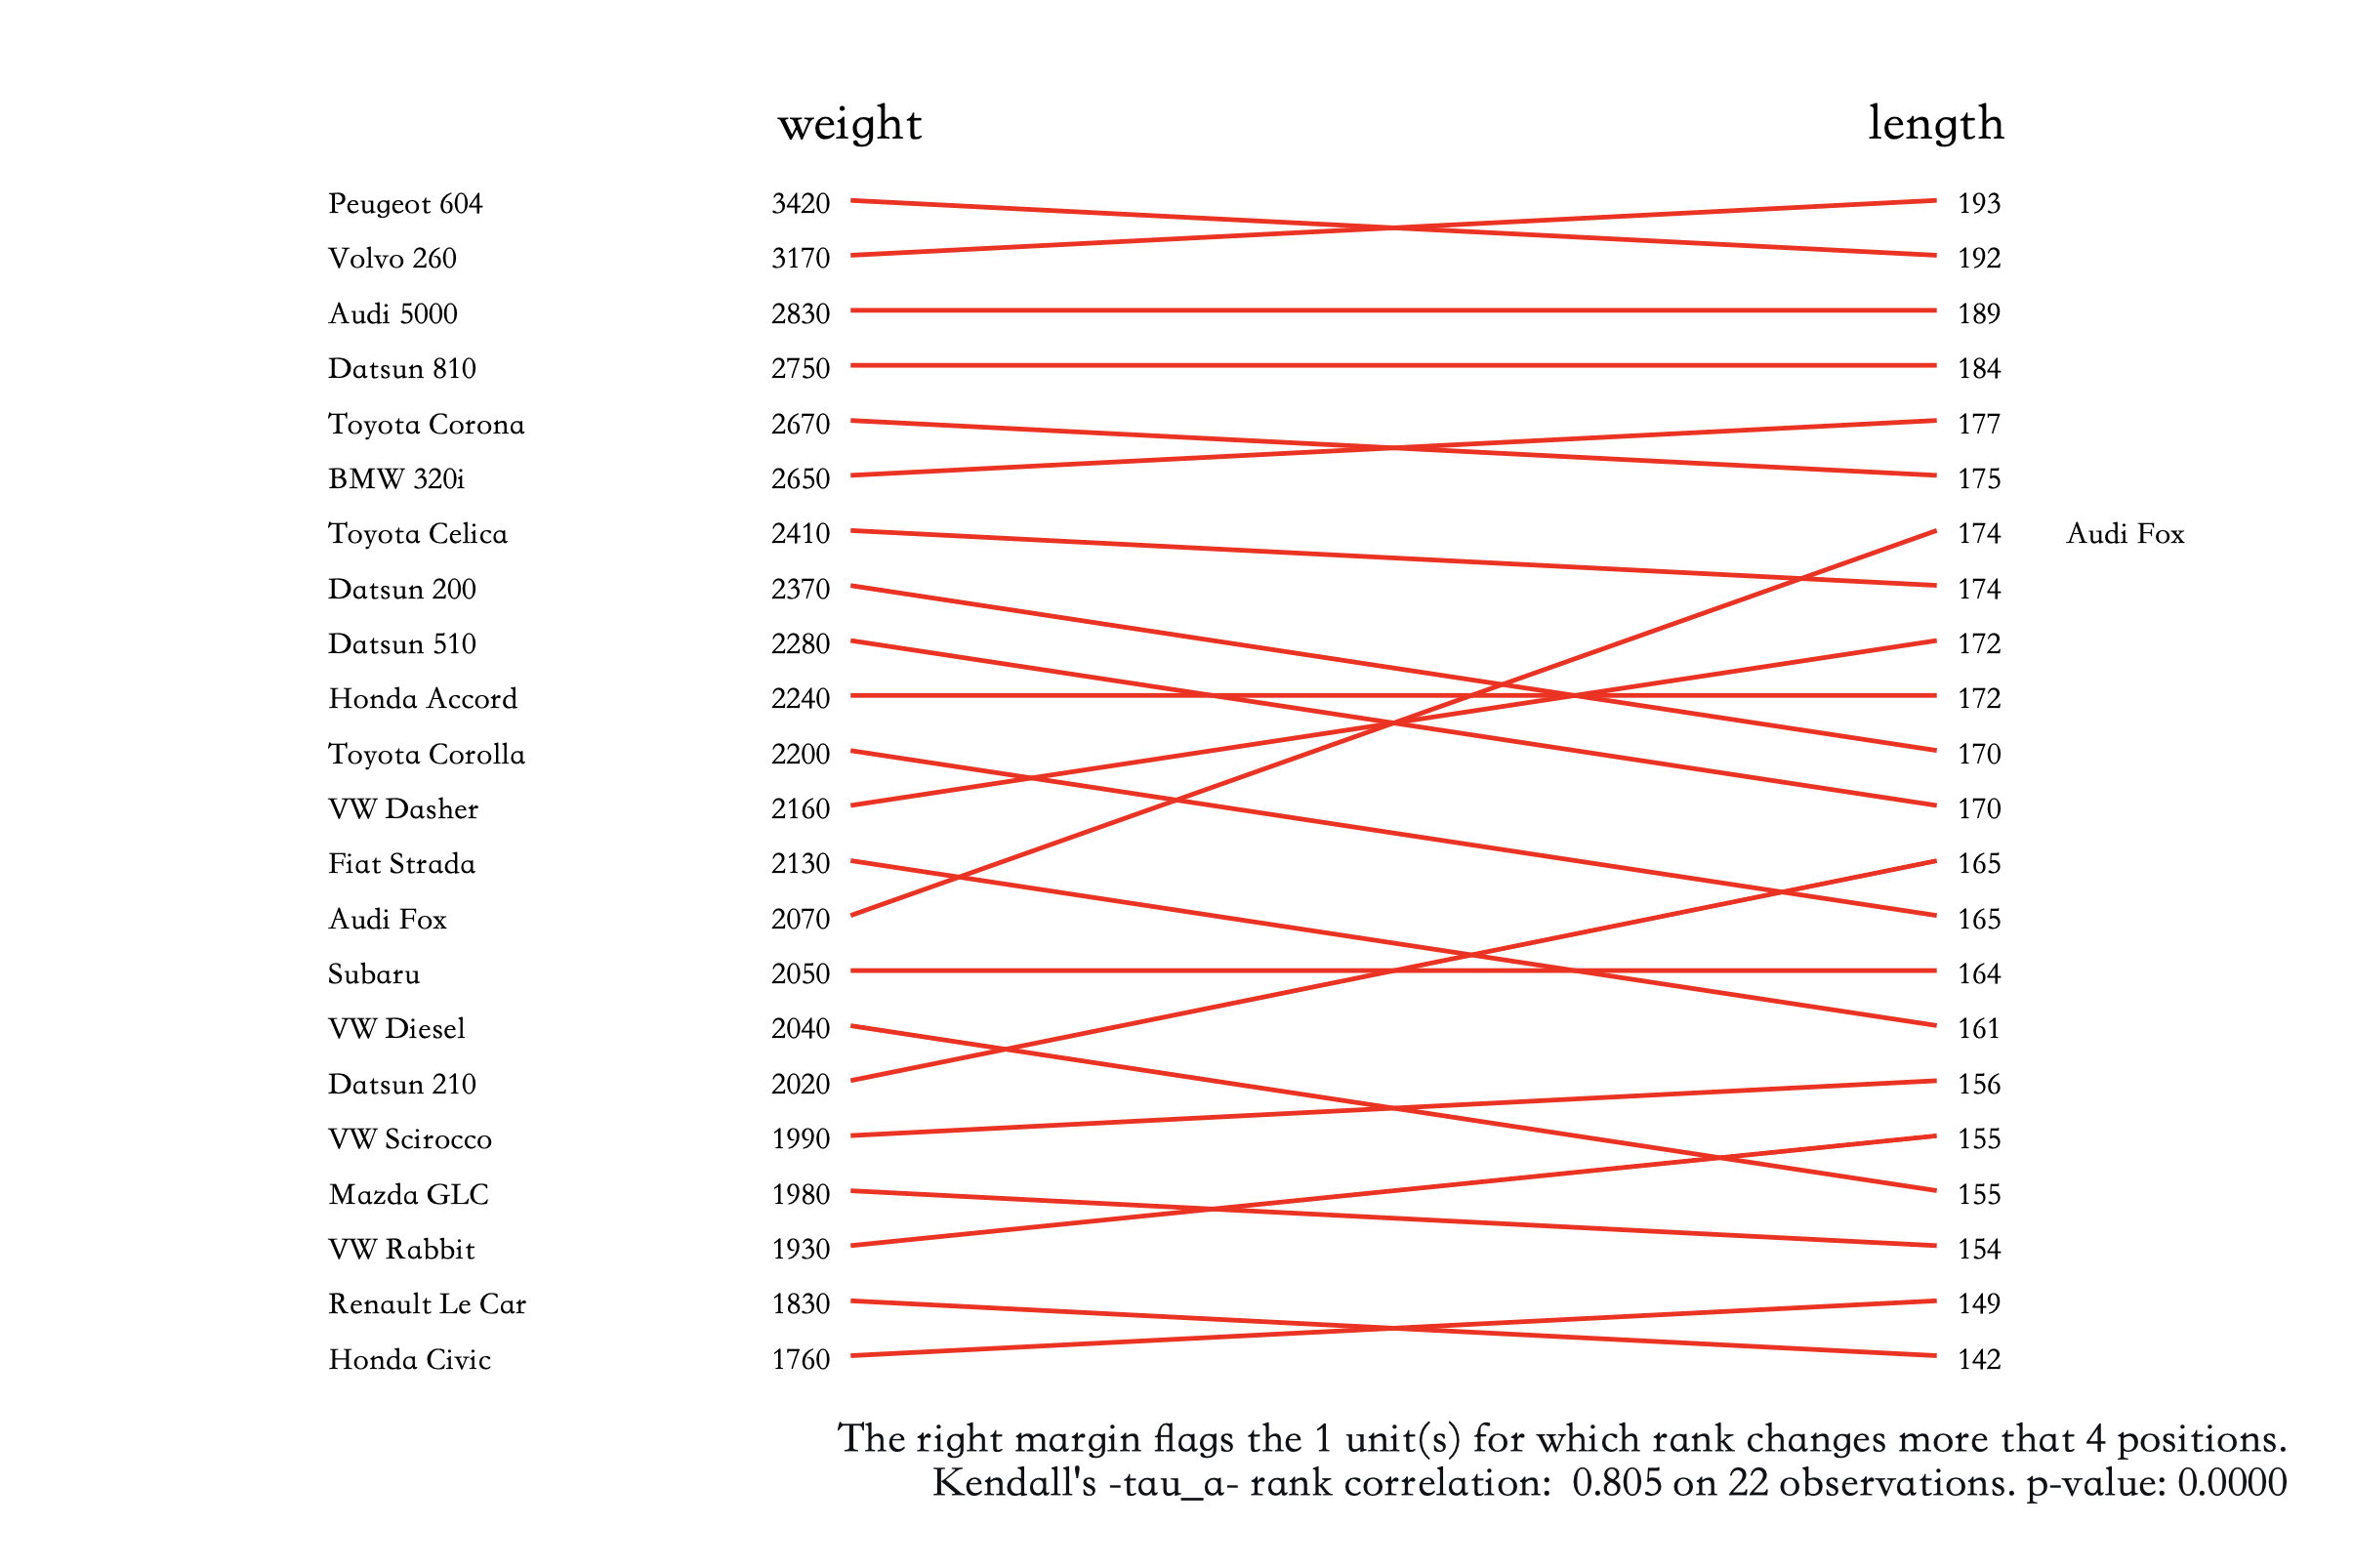
使用 mlabcolor() 可以设置文本的颜色,lcolor() 可以设置线条的颜色:
rankplot weight length if foreign, id(make) mlabcolor(black) lcolor(red)
|
| 图表 |
 |
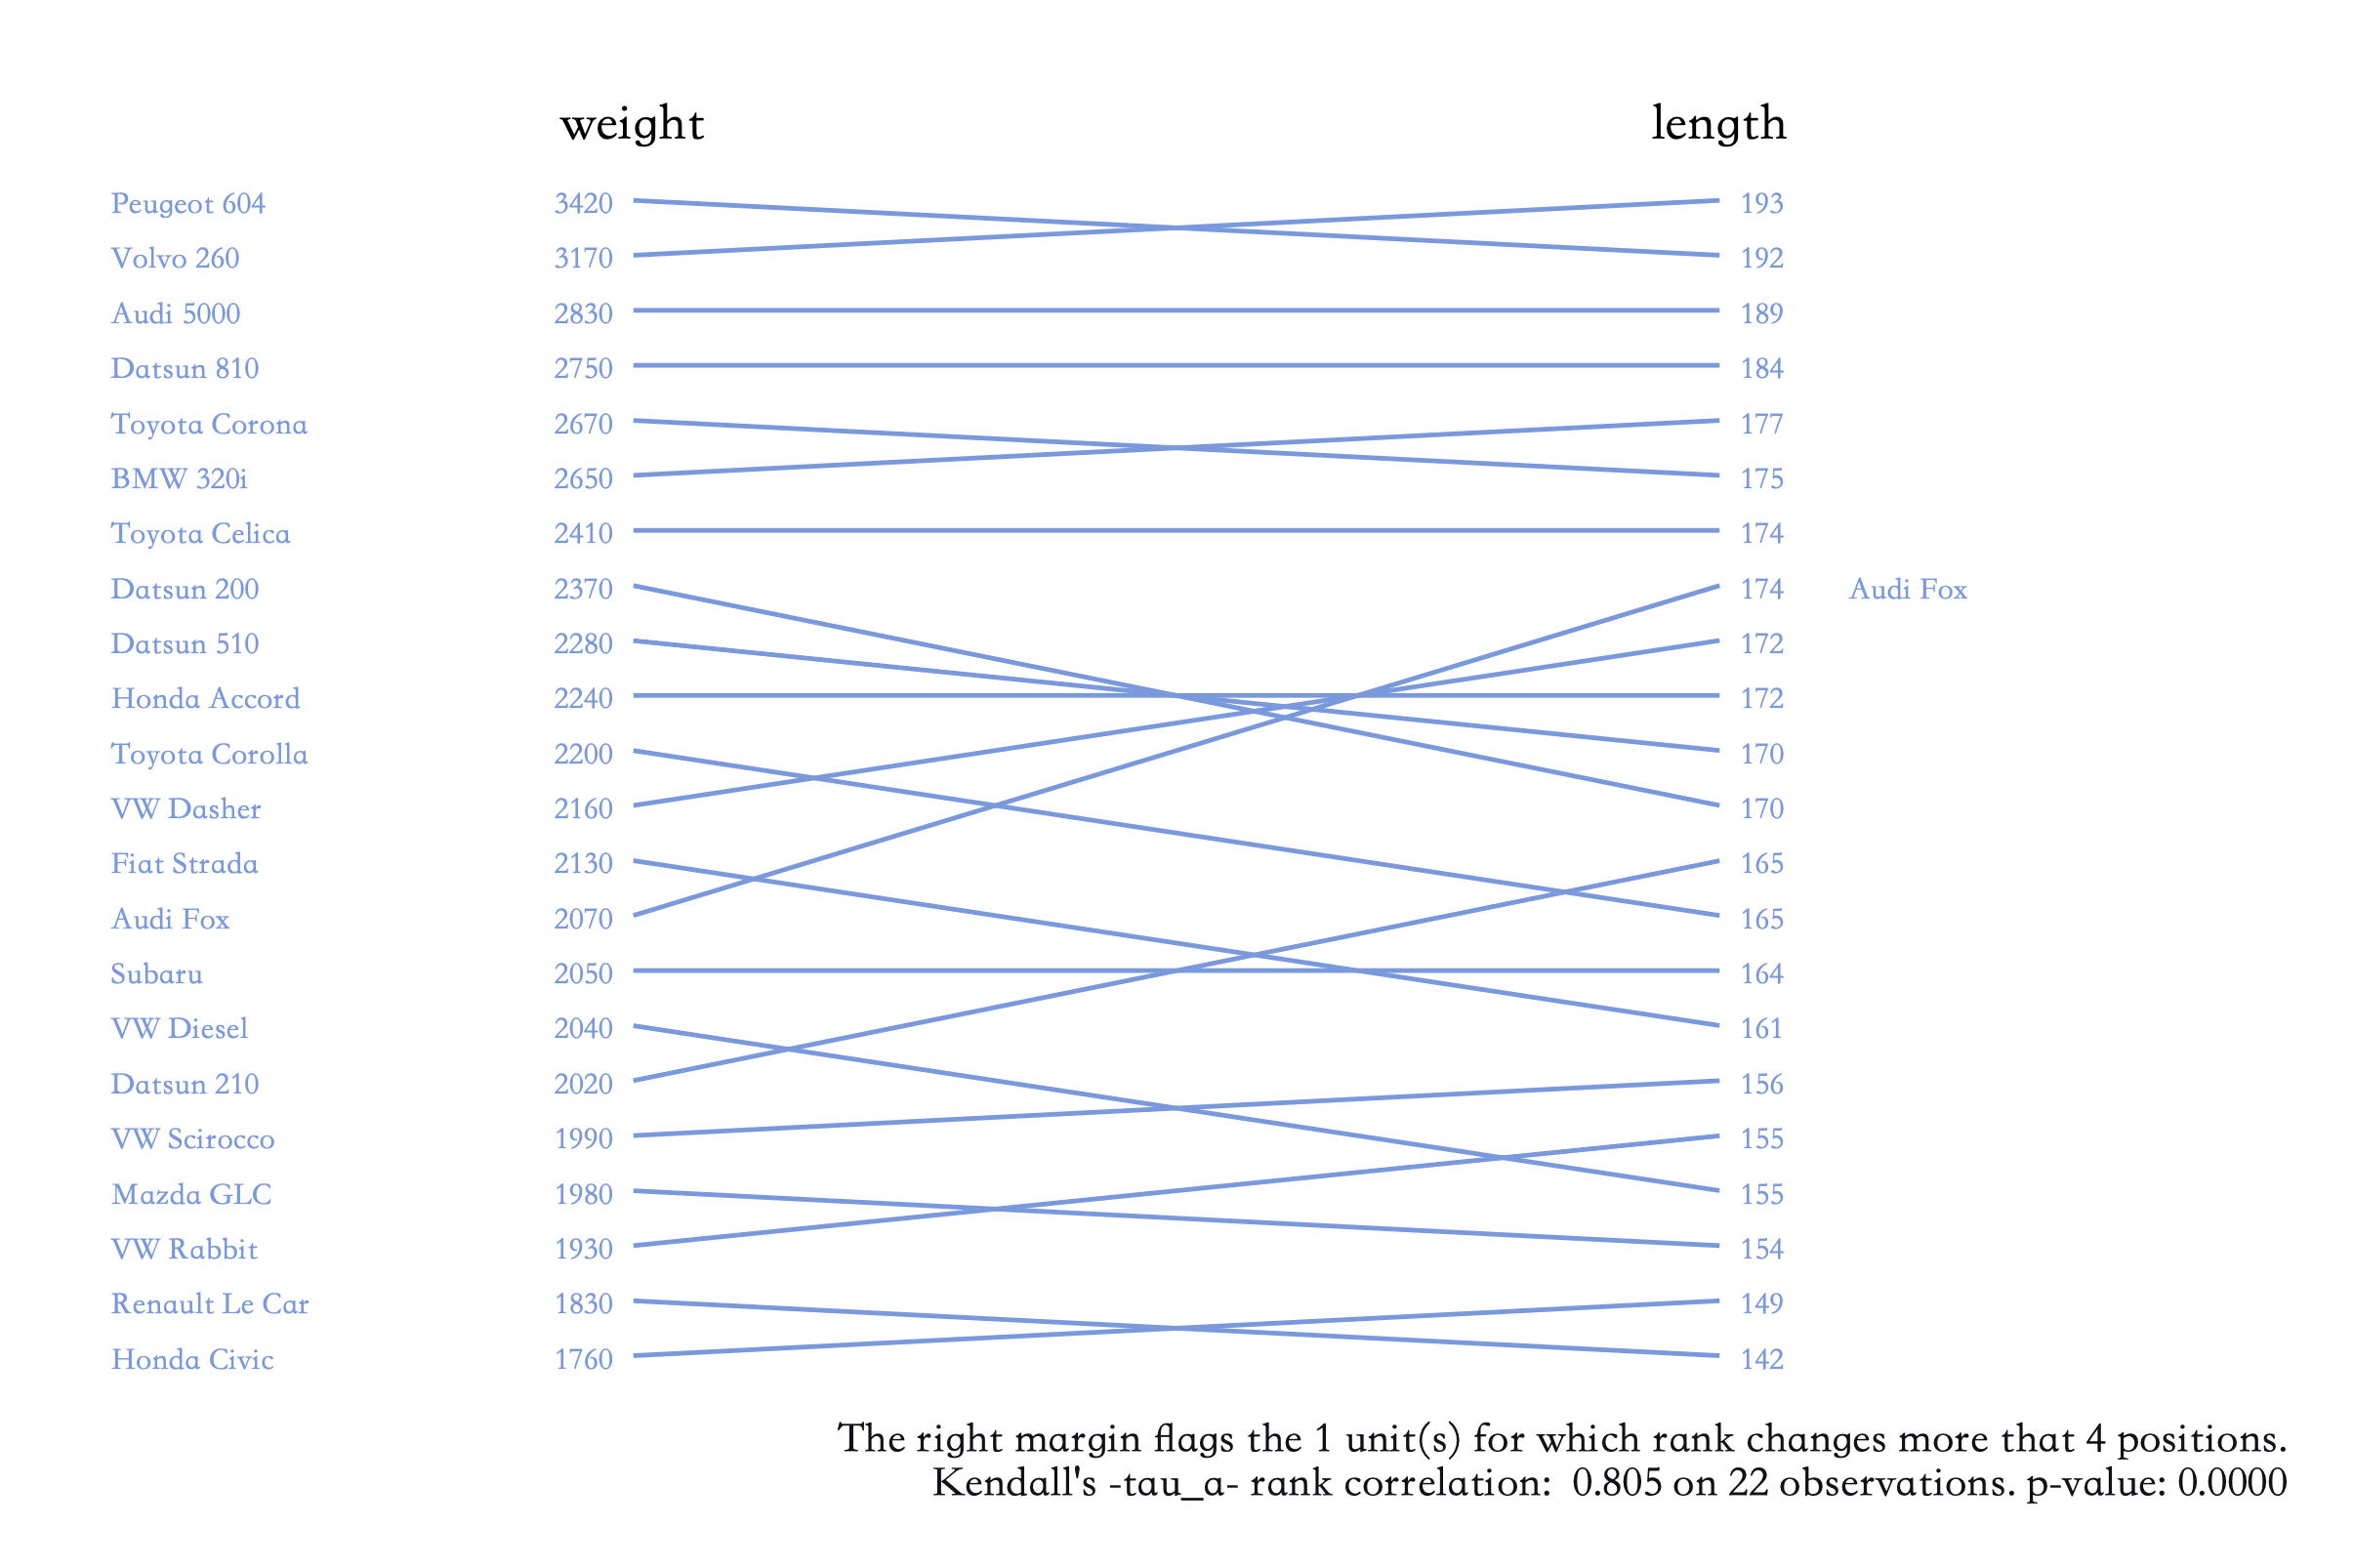
shift() 选项可以将图表内容进行平移,例如向左移动 0.2 单位:
rankplot weight length if foreign, id(make) shift(-0.2)
|
| 图表 |
 |
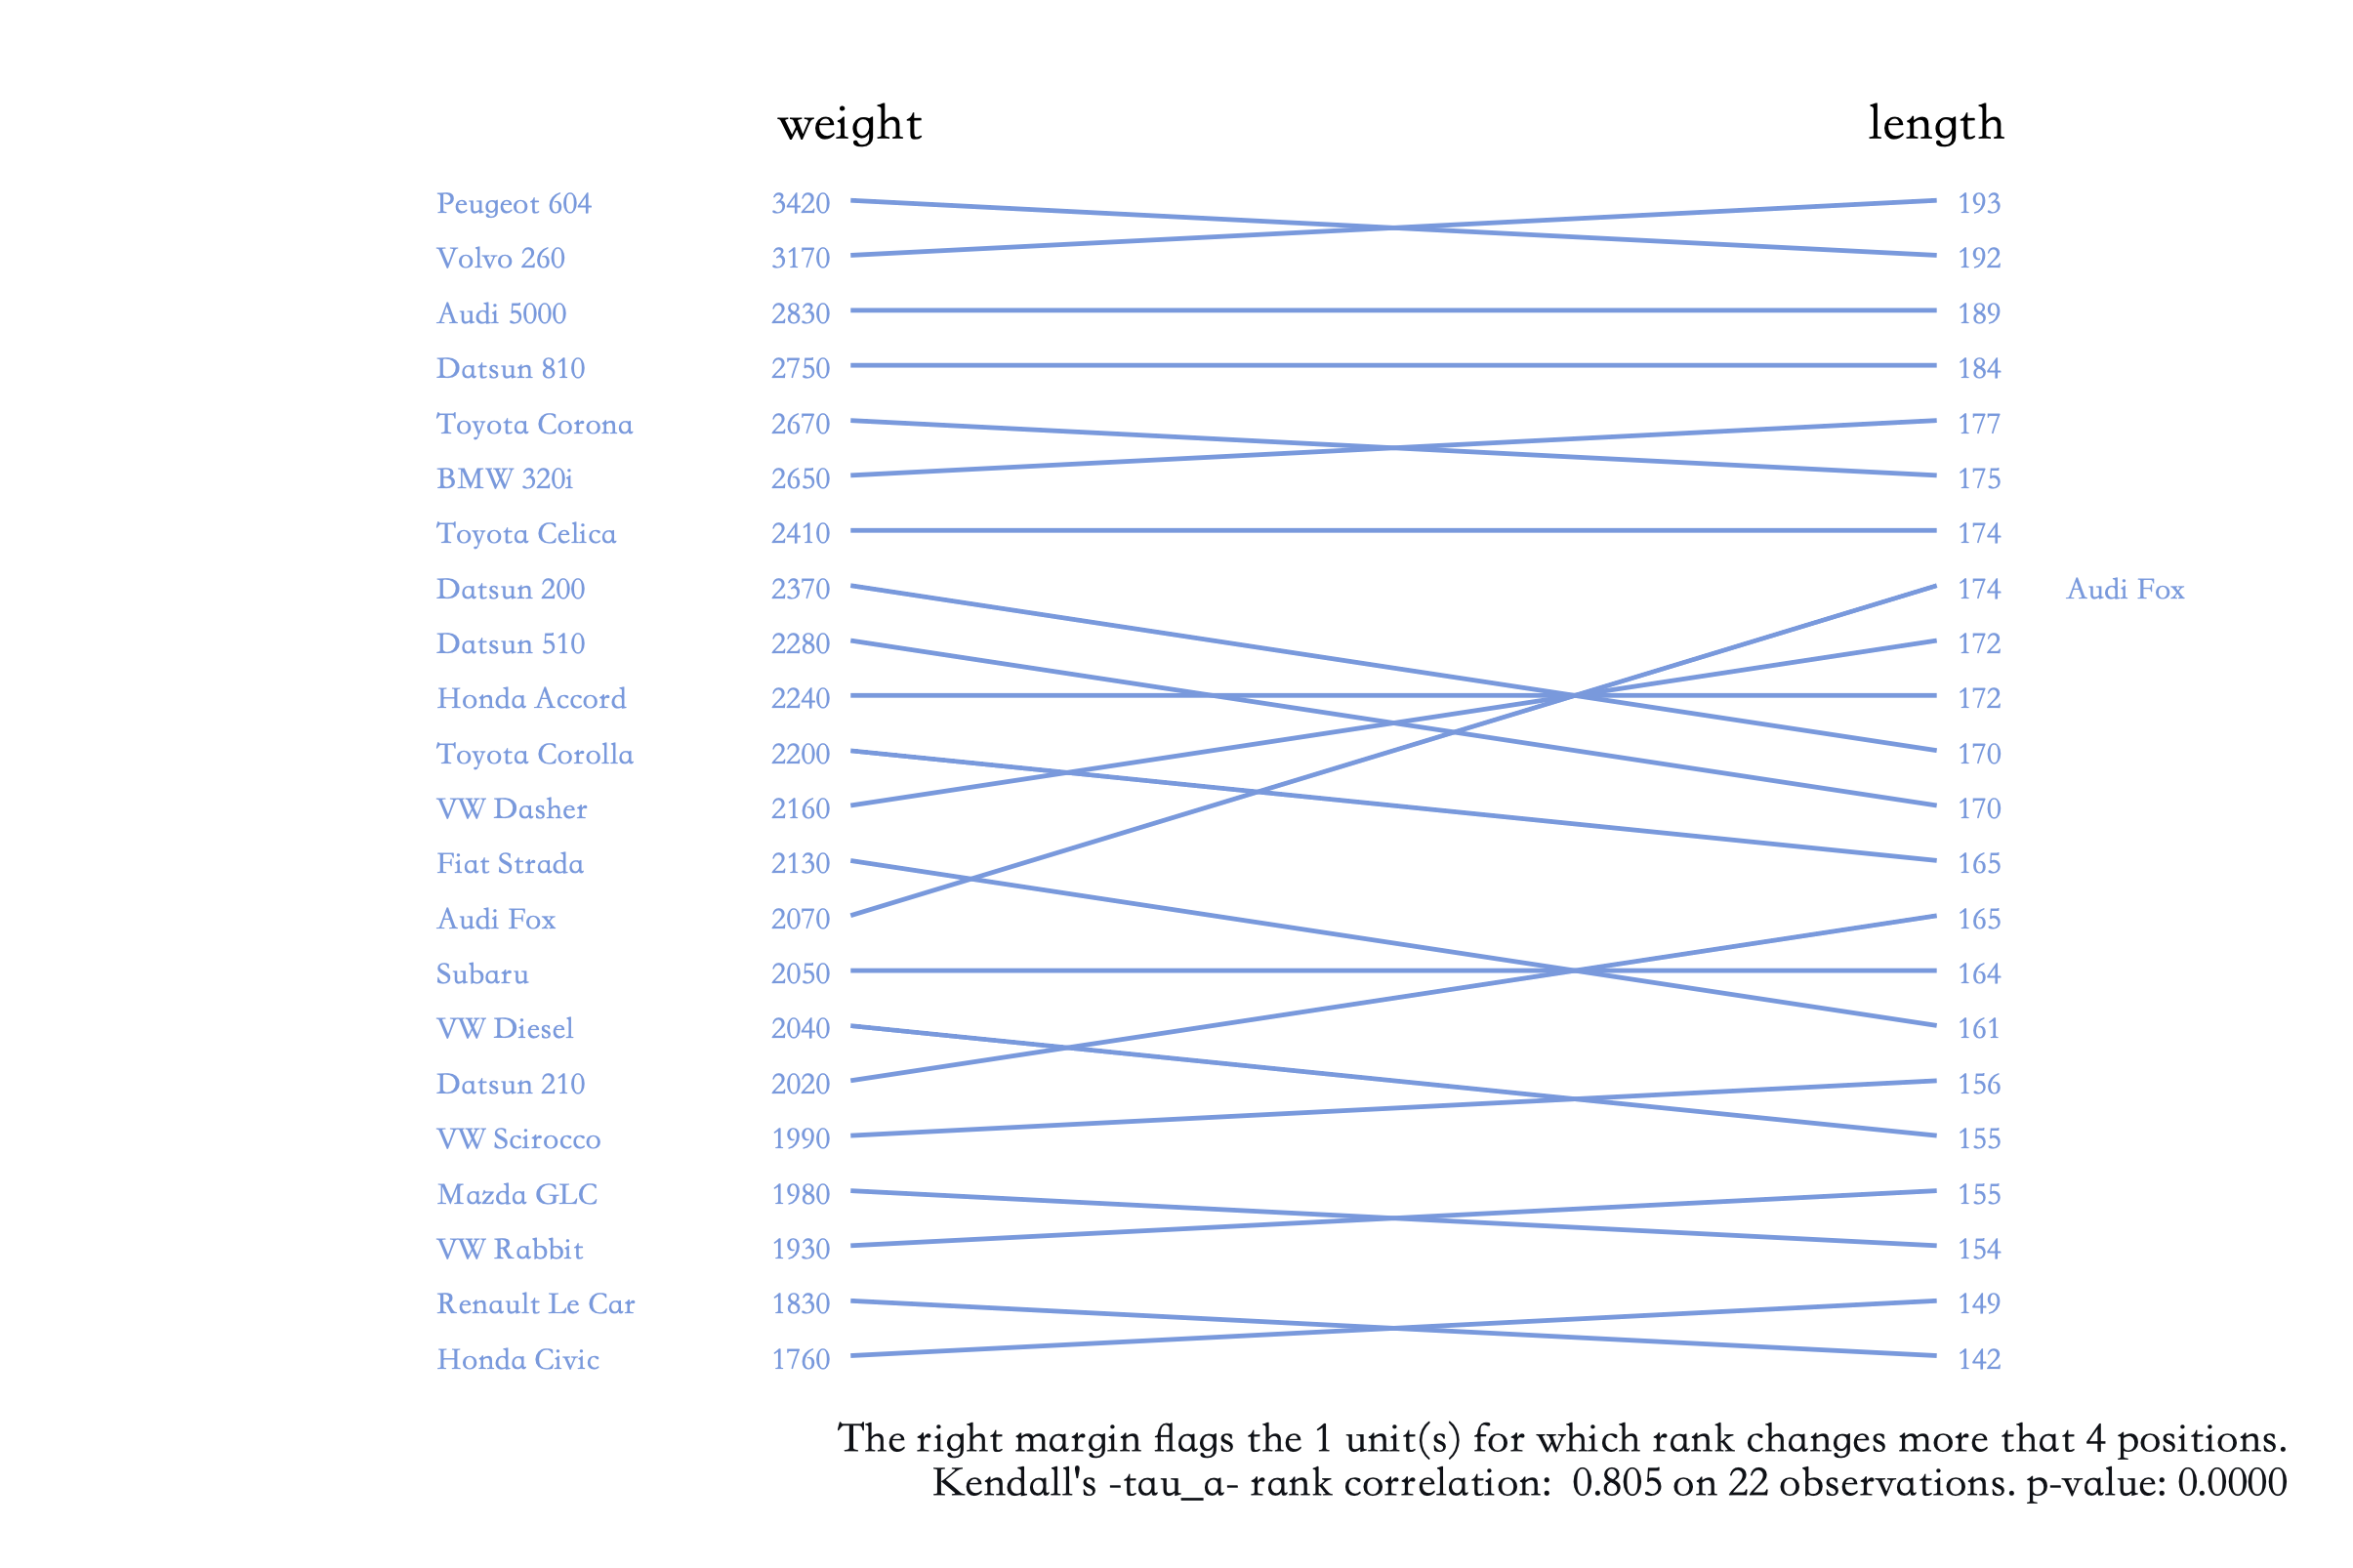
margadjust() 选项仅仅移动左侧的文本,例如将文本向右移动 0.1 单位:
rankplot weight length if foreign, id(make) margadjust(0.1)
|
| 图表 |
 |
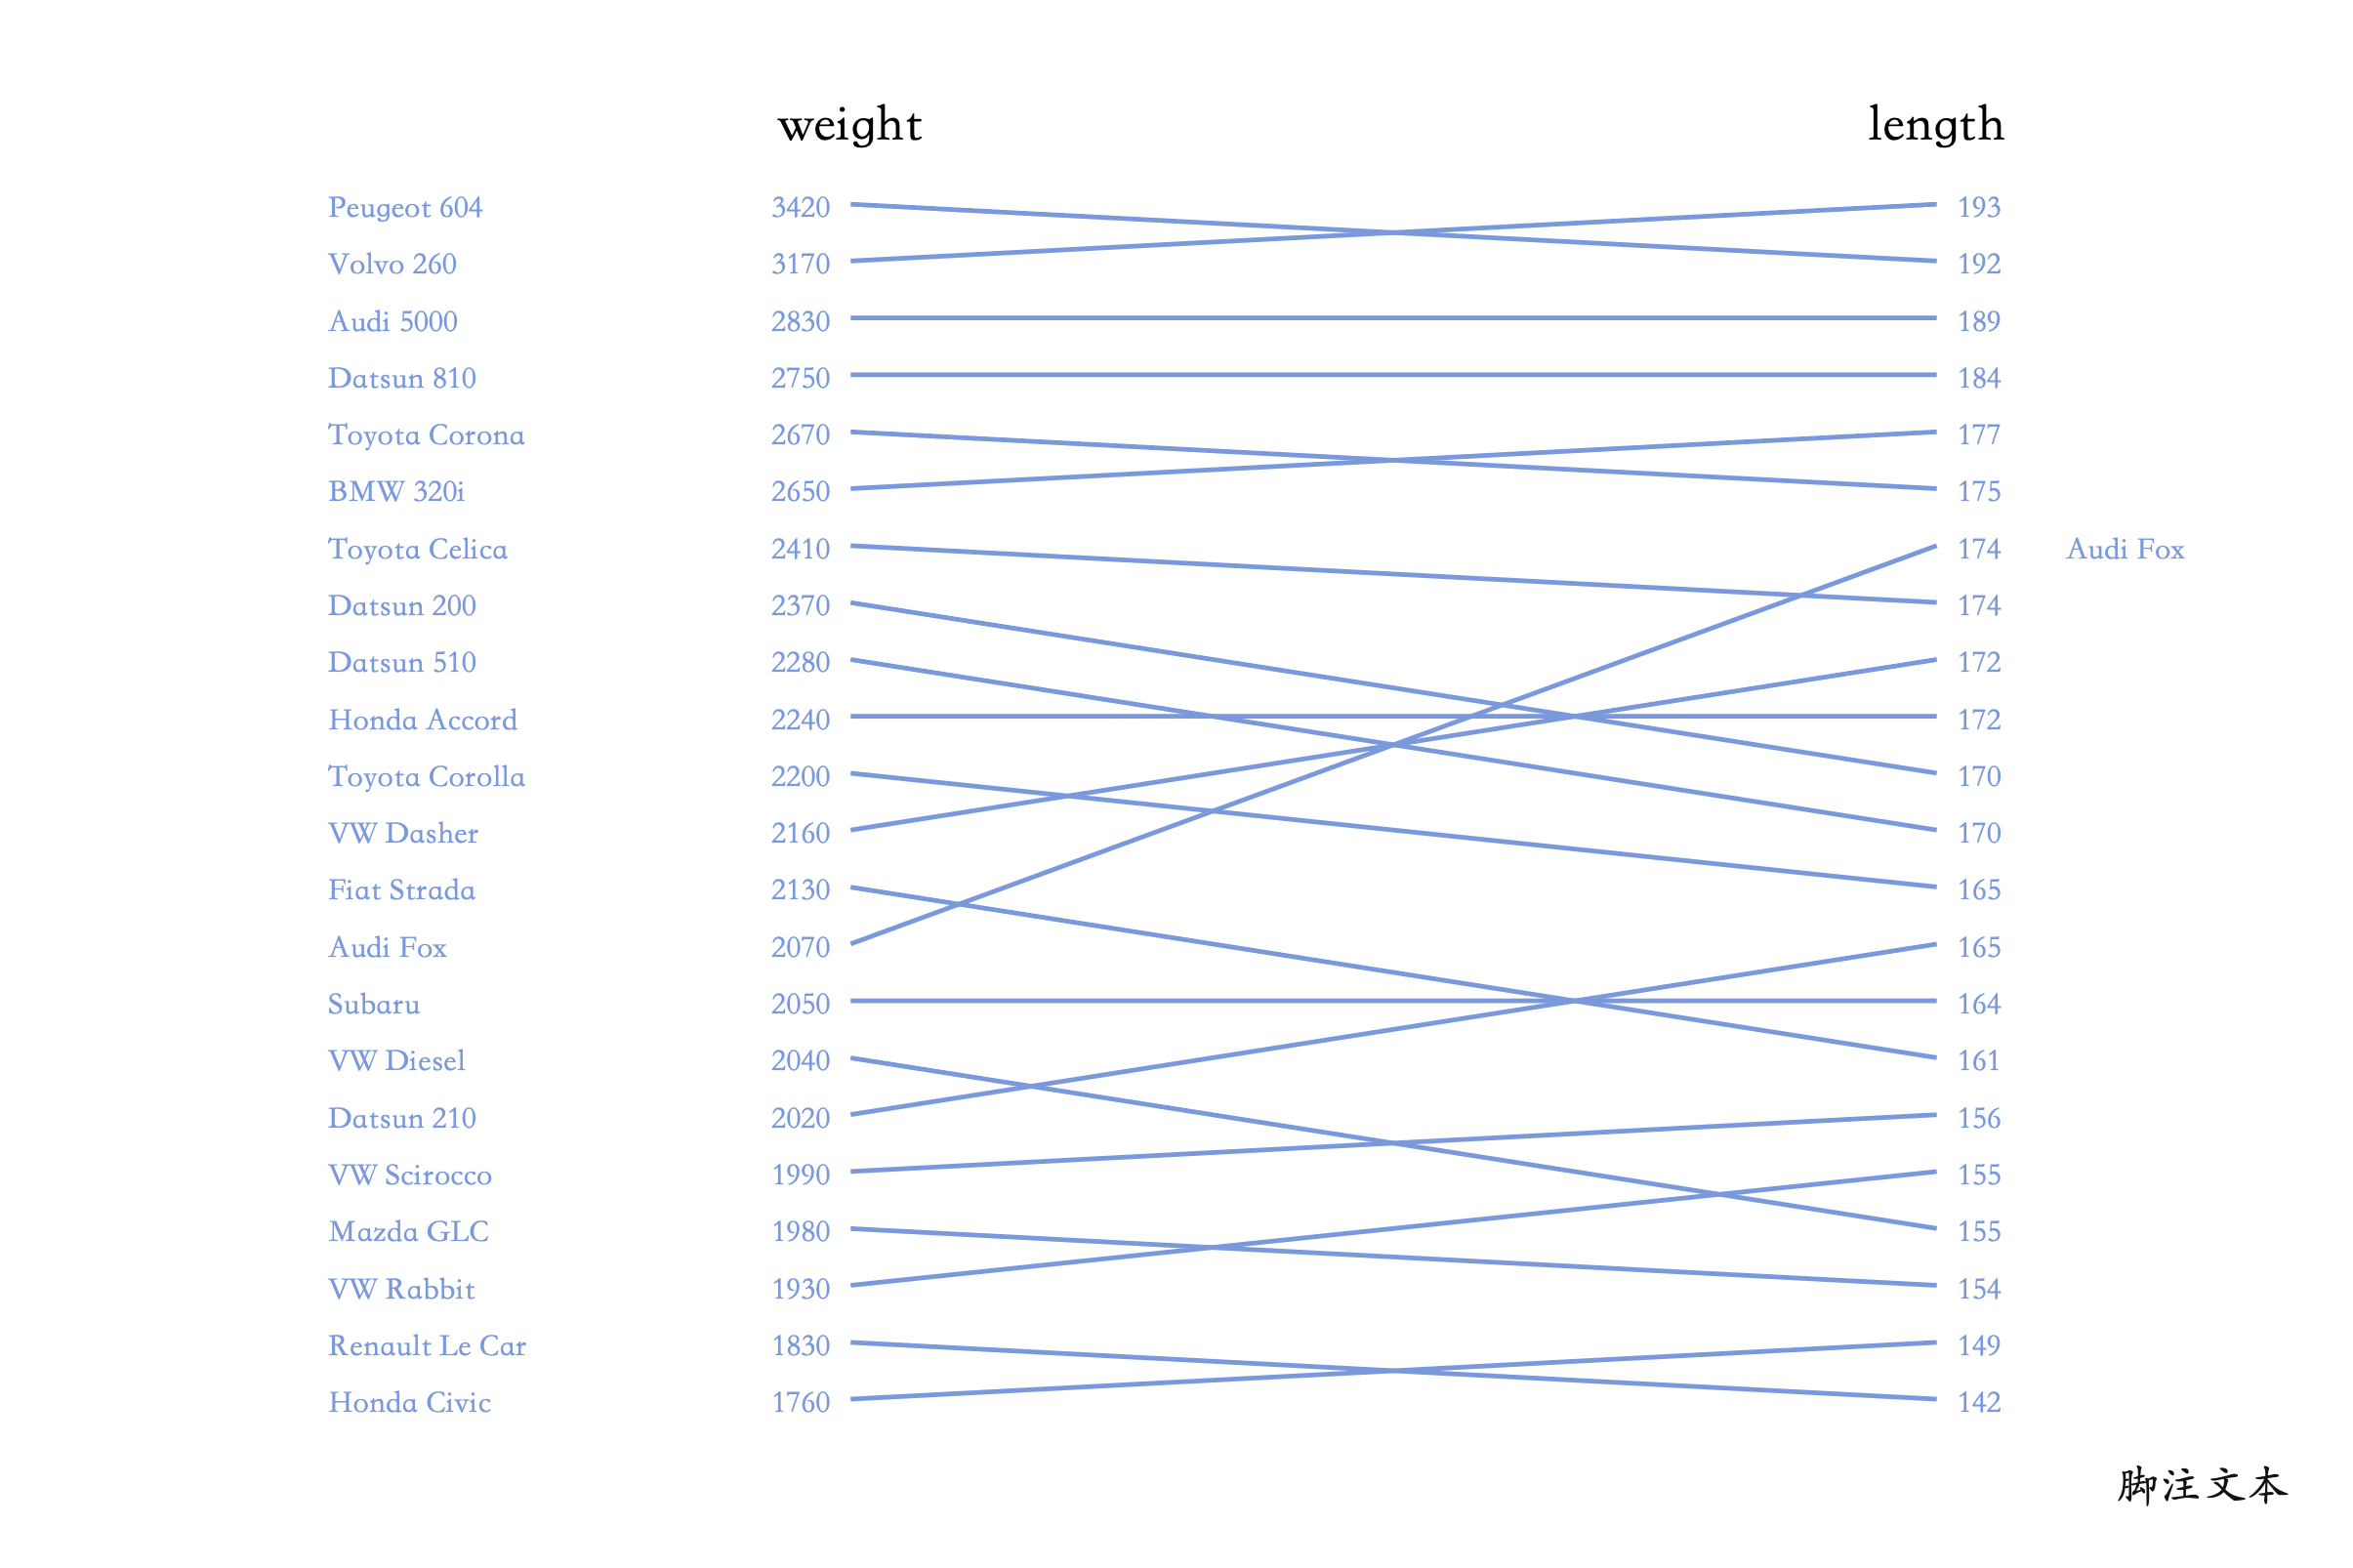
nonote 选项可以隐藏右下角的脚注,不过也可以使用 note() 选择设置脚注文本:
rankplot weight length if foreign, id(make) note("脚注文本")
|
| 图表 |
 |
更多内容大家可以参考帮助文档学习~
点击这里跳转到 RStata 短书平台获取附件:rankplot:使用 Stata 绘制排名比对图
评论