prov %>%
  mutate(id = row.names(.)) %>%
  nest(-id) %>%
  mutate(stbbox = map(data, .f = function(x){
    st_bbox(x) %>%
      st_as_sfc() %>%
      st_cast("MULTILINESTRING")
  })) %>%
  unnest(data) %>%
  select(-id, -geometry) %>%
  rename(geometry = stbbox) %>%
  mutate(geometry = map(geometry, .f = function(x){
    x[[1]]
  })) %>%
  st_sf(crs = 4326) -> provbbox

ggplot(st_simplify(prov, dTolerance = 0.02)) +
  geom_sf(fill = NA, color = "black",
          size = 0.2) +
  geom_sf(data = jdx, color = "black",
          size = 0.5) +
  geom_sf(data = provbbox, color = "#18BC9C") +
  coord_sf(crs = "+proj=lcc +lat_1=30 +lat_2=62 +lat_0=0 +lon_0=105 +x_0=0 +y_0=0 +ellps=krass +units=m +no_defs") +
  annotate("text", x = -3450000, y = 2800000,
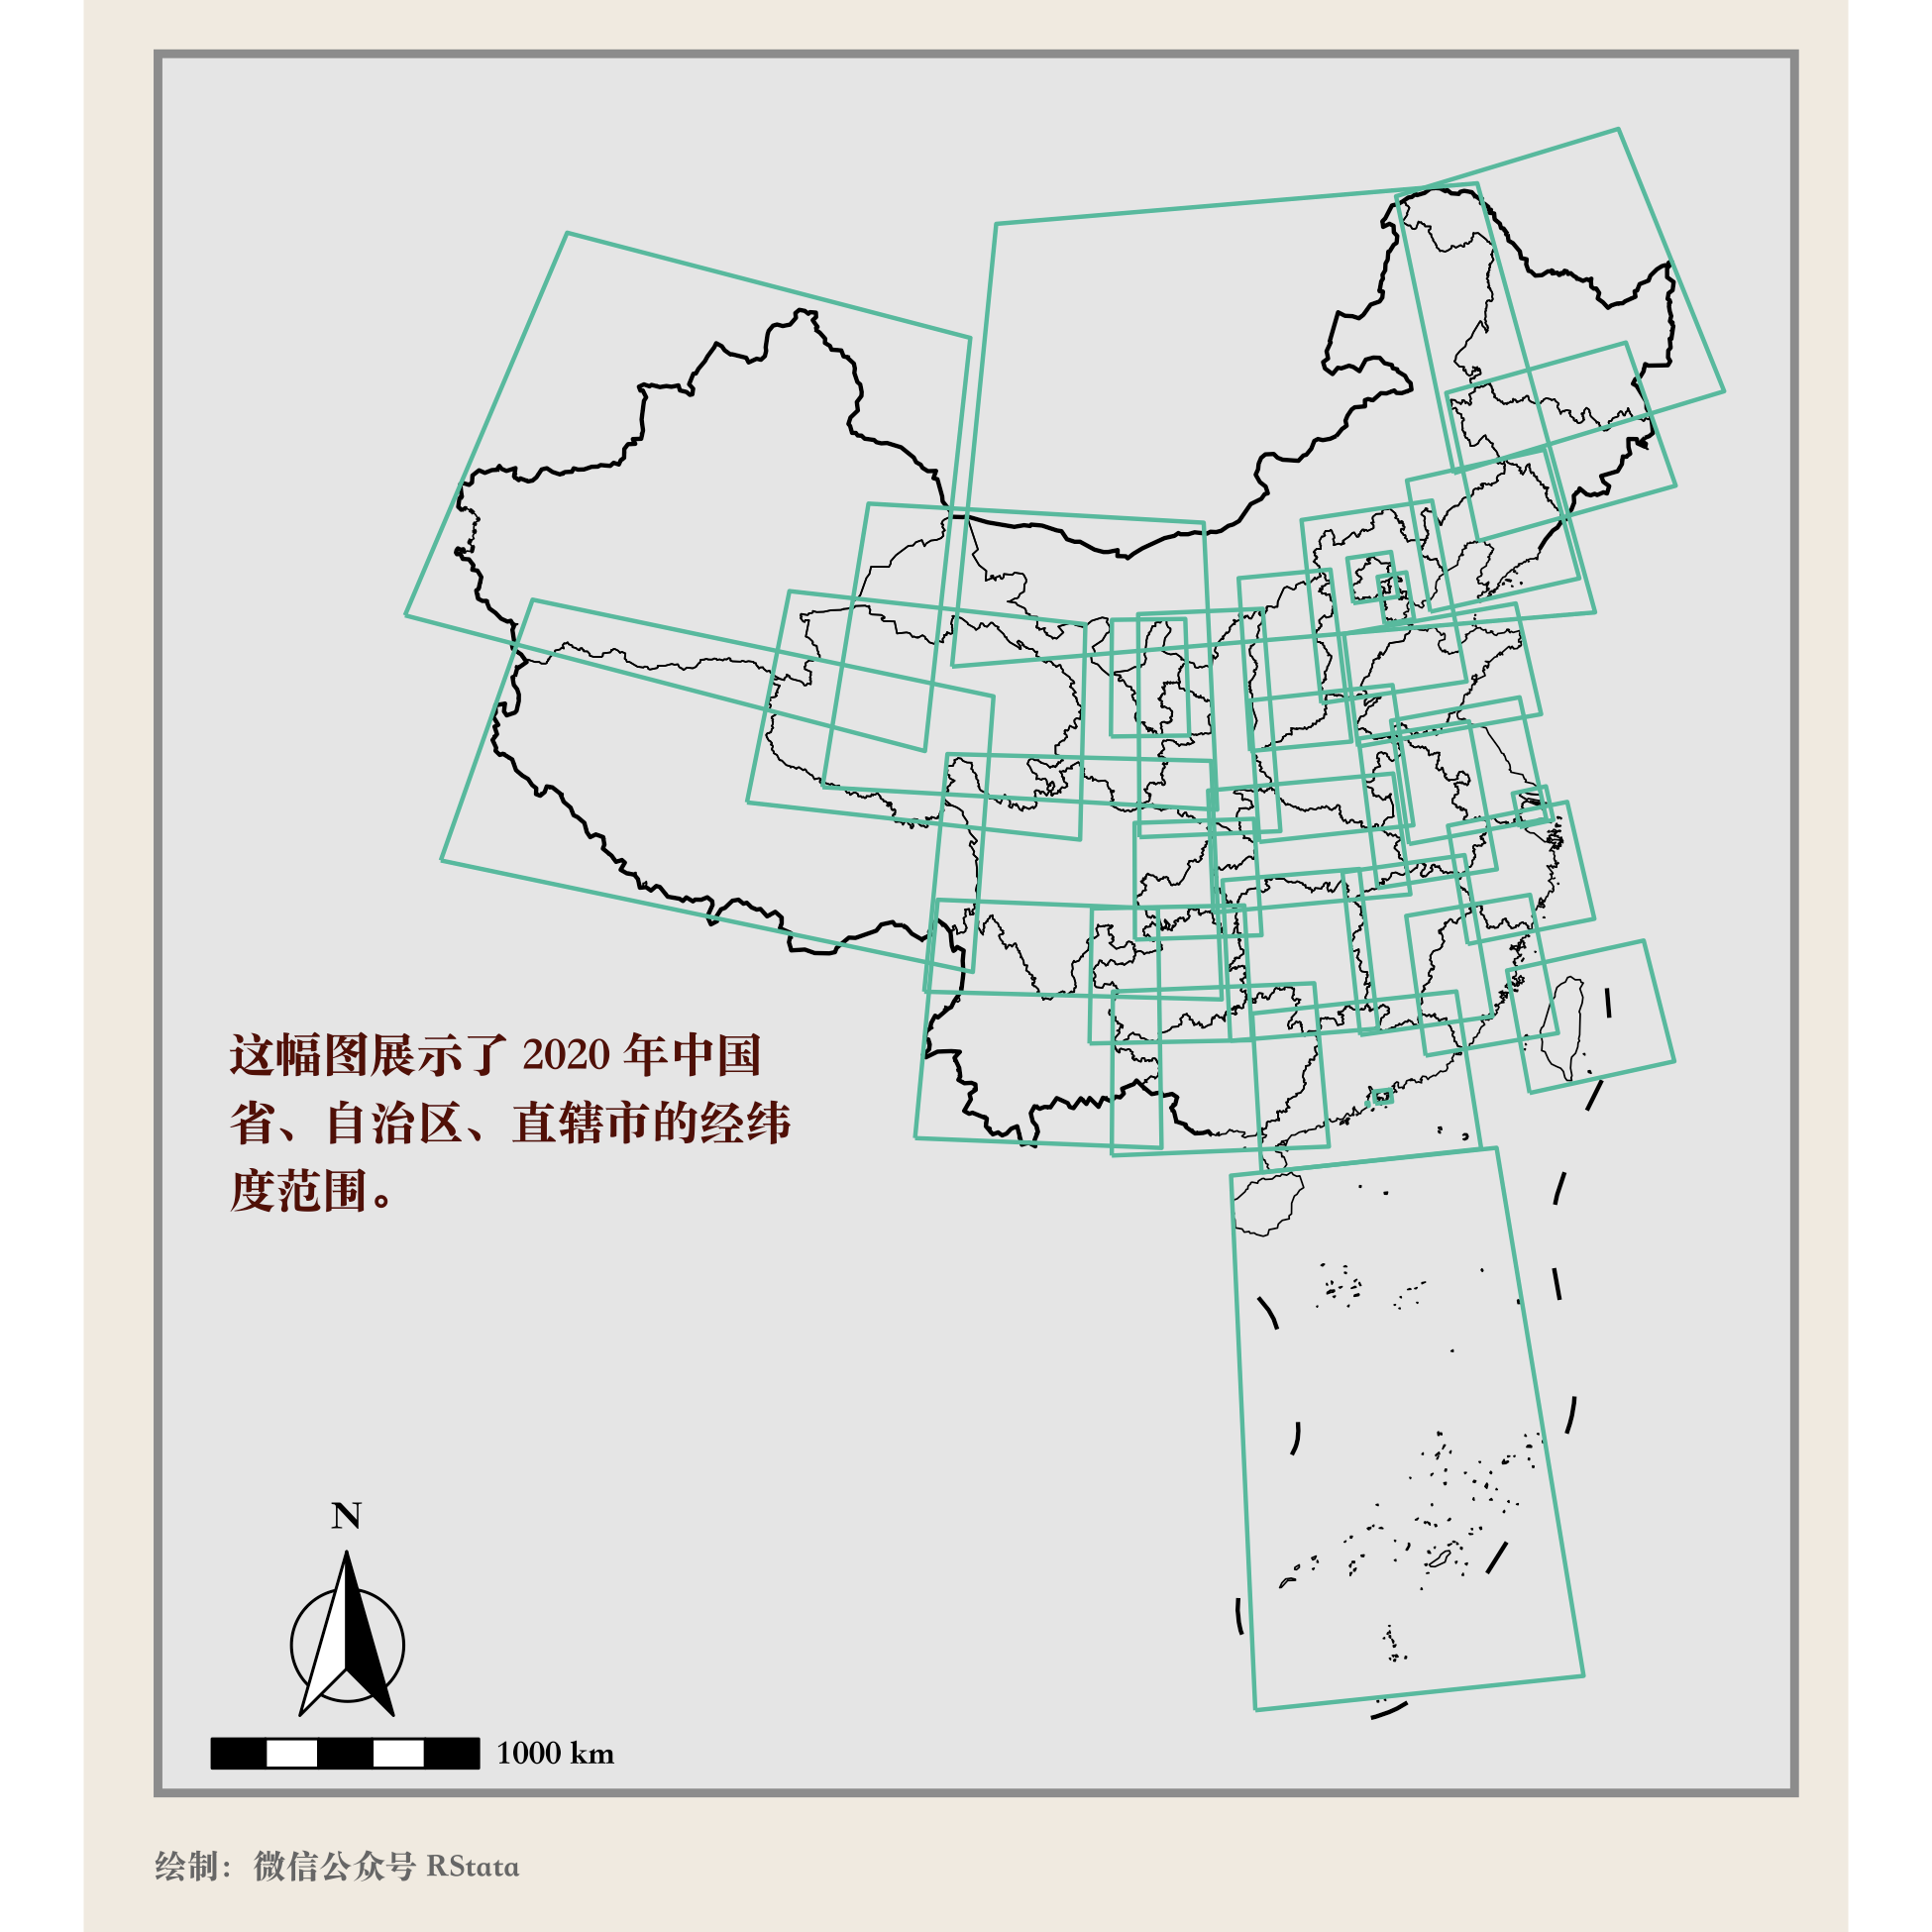
           label = str_wrap(paste0("这幅图展示了 2020 年中国省、自治区、直辖市的经纬度范围。"), width = 25),
           family = "Songti", hjust = 0,
           color = "#580000", size = 4) +
  annotation_scale(
    width_hint = 0.2,
    text_family = "Songti",
    pad_x = unit(0.5, "cm")
  ) +
  annotation_north_arrow(
    location = "bl",
    which_north = "false",
    pad_x = unit(0.85, "cm"),
    pad_y = unit(0.5, "cm"),
    width = unit(1.6, "cm"),
    height = unit(2, "cm"),
    style = north_arrow_fancy_orienteering(
      text_family = "Songti"
    )
  ) +
  labs(caption = "绘制:微信公众号 RStata")

ggsave("2020各省份经纬度范围.png", width = 6.5, height = 6.5)
|
评论