local nrow = r(N) local ncol = r(k) global aspectratio = `nrow' / `ncol'
aspectratio 为图表的长宽比,在后续的绘图中会被使用。
生成行号并把行号变量放到最前面:
gen row = _n order row
使用 gather 命令可以把这个数据转换成长数据:
gather v*
其中 gather 命令是个外部命令,可以使用 ssc install tidy 安装。
下面我们再把 variable 变量处理成列号:
ren variable col replace col = subinstr(col, "v", "", .) destring col, replace ren value v
这里的 v 值就是红色的深浅值,这里我们用灰色绘图。
由于 Stata 不支持把变量值直接映射为散点的颜色,所以我们需要一个个图层的绘制散点图,每个 v 值绘制一个图层,由于 v 的取值很多,所以我们需要对 v 进行 round() 来减少药绘制的图层,先从 0.1 尝试:
* v 越大颜色越浅,所以用 1-v 替换 v,这样就是 v 越大,颜色越深了: replace v = 1 - v gen v1 = string(round(v, 0.01), "%6.1f")
* 保存数据 save photodata, replace
然后我们就可以绘图了:
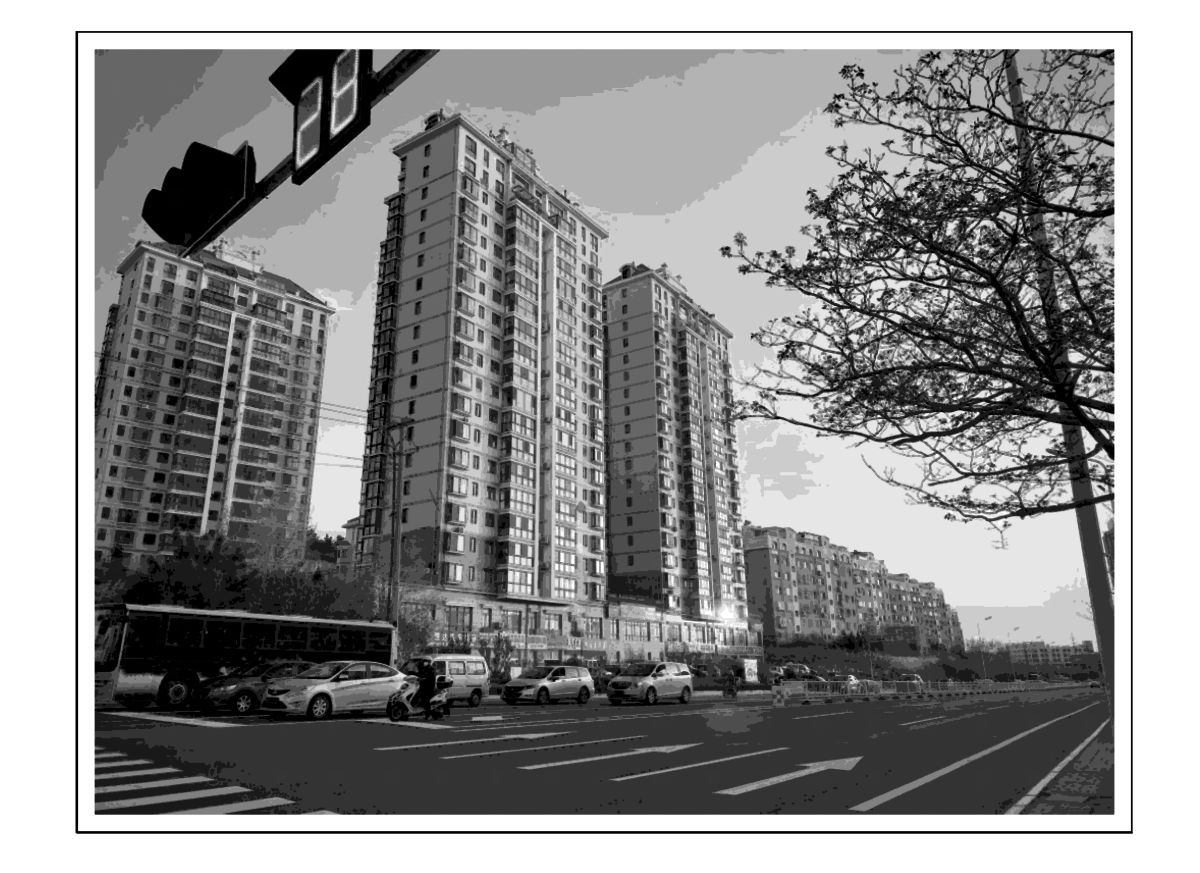
use photodata, clear * 镜像 replace row = -row tw/// sc row col if v1 == "0.1", msize(vtiny) mc(black*0.1) || /// sc row col if v1 == "0.2", msize(vtiny) mc(black*0.2) || /// sc row col if v1 == "0.3", msize(vtiny) mc(black*0.3) || /// sc row col if v1 == "0.4", msize(vtiny) mc(black*0.4) || /// sc row col if v1 == "0.5", msize(vtiny) mc(black*0.5) || /// sc row col if v1 == "0.6", msize(vtiny) mc(black*0.6) || /// sc row col if v1 == "0.7", msize(vtiny) mc(black*0.7) || /// sc row col if v1 == "0.8", msize(vtiny) mc(black*0.8) || /// sc row col if v1 == "0.9", msize(vtiny) mc(black*0.9) || /// sc row col if v1 == "1.0", msize(vtiny) mc(black) /// ytitle("") /// xtitle("") /// ylabel("") /// xlabel("") /// legend(off) /// aspect(${aspectratio}) /// scheme(s1color)
图表
显然这个绘制的结果很不精致!这都是因为前面选择了 round(0.1)!
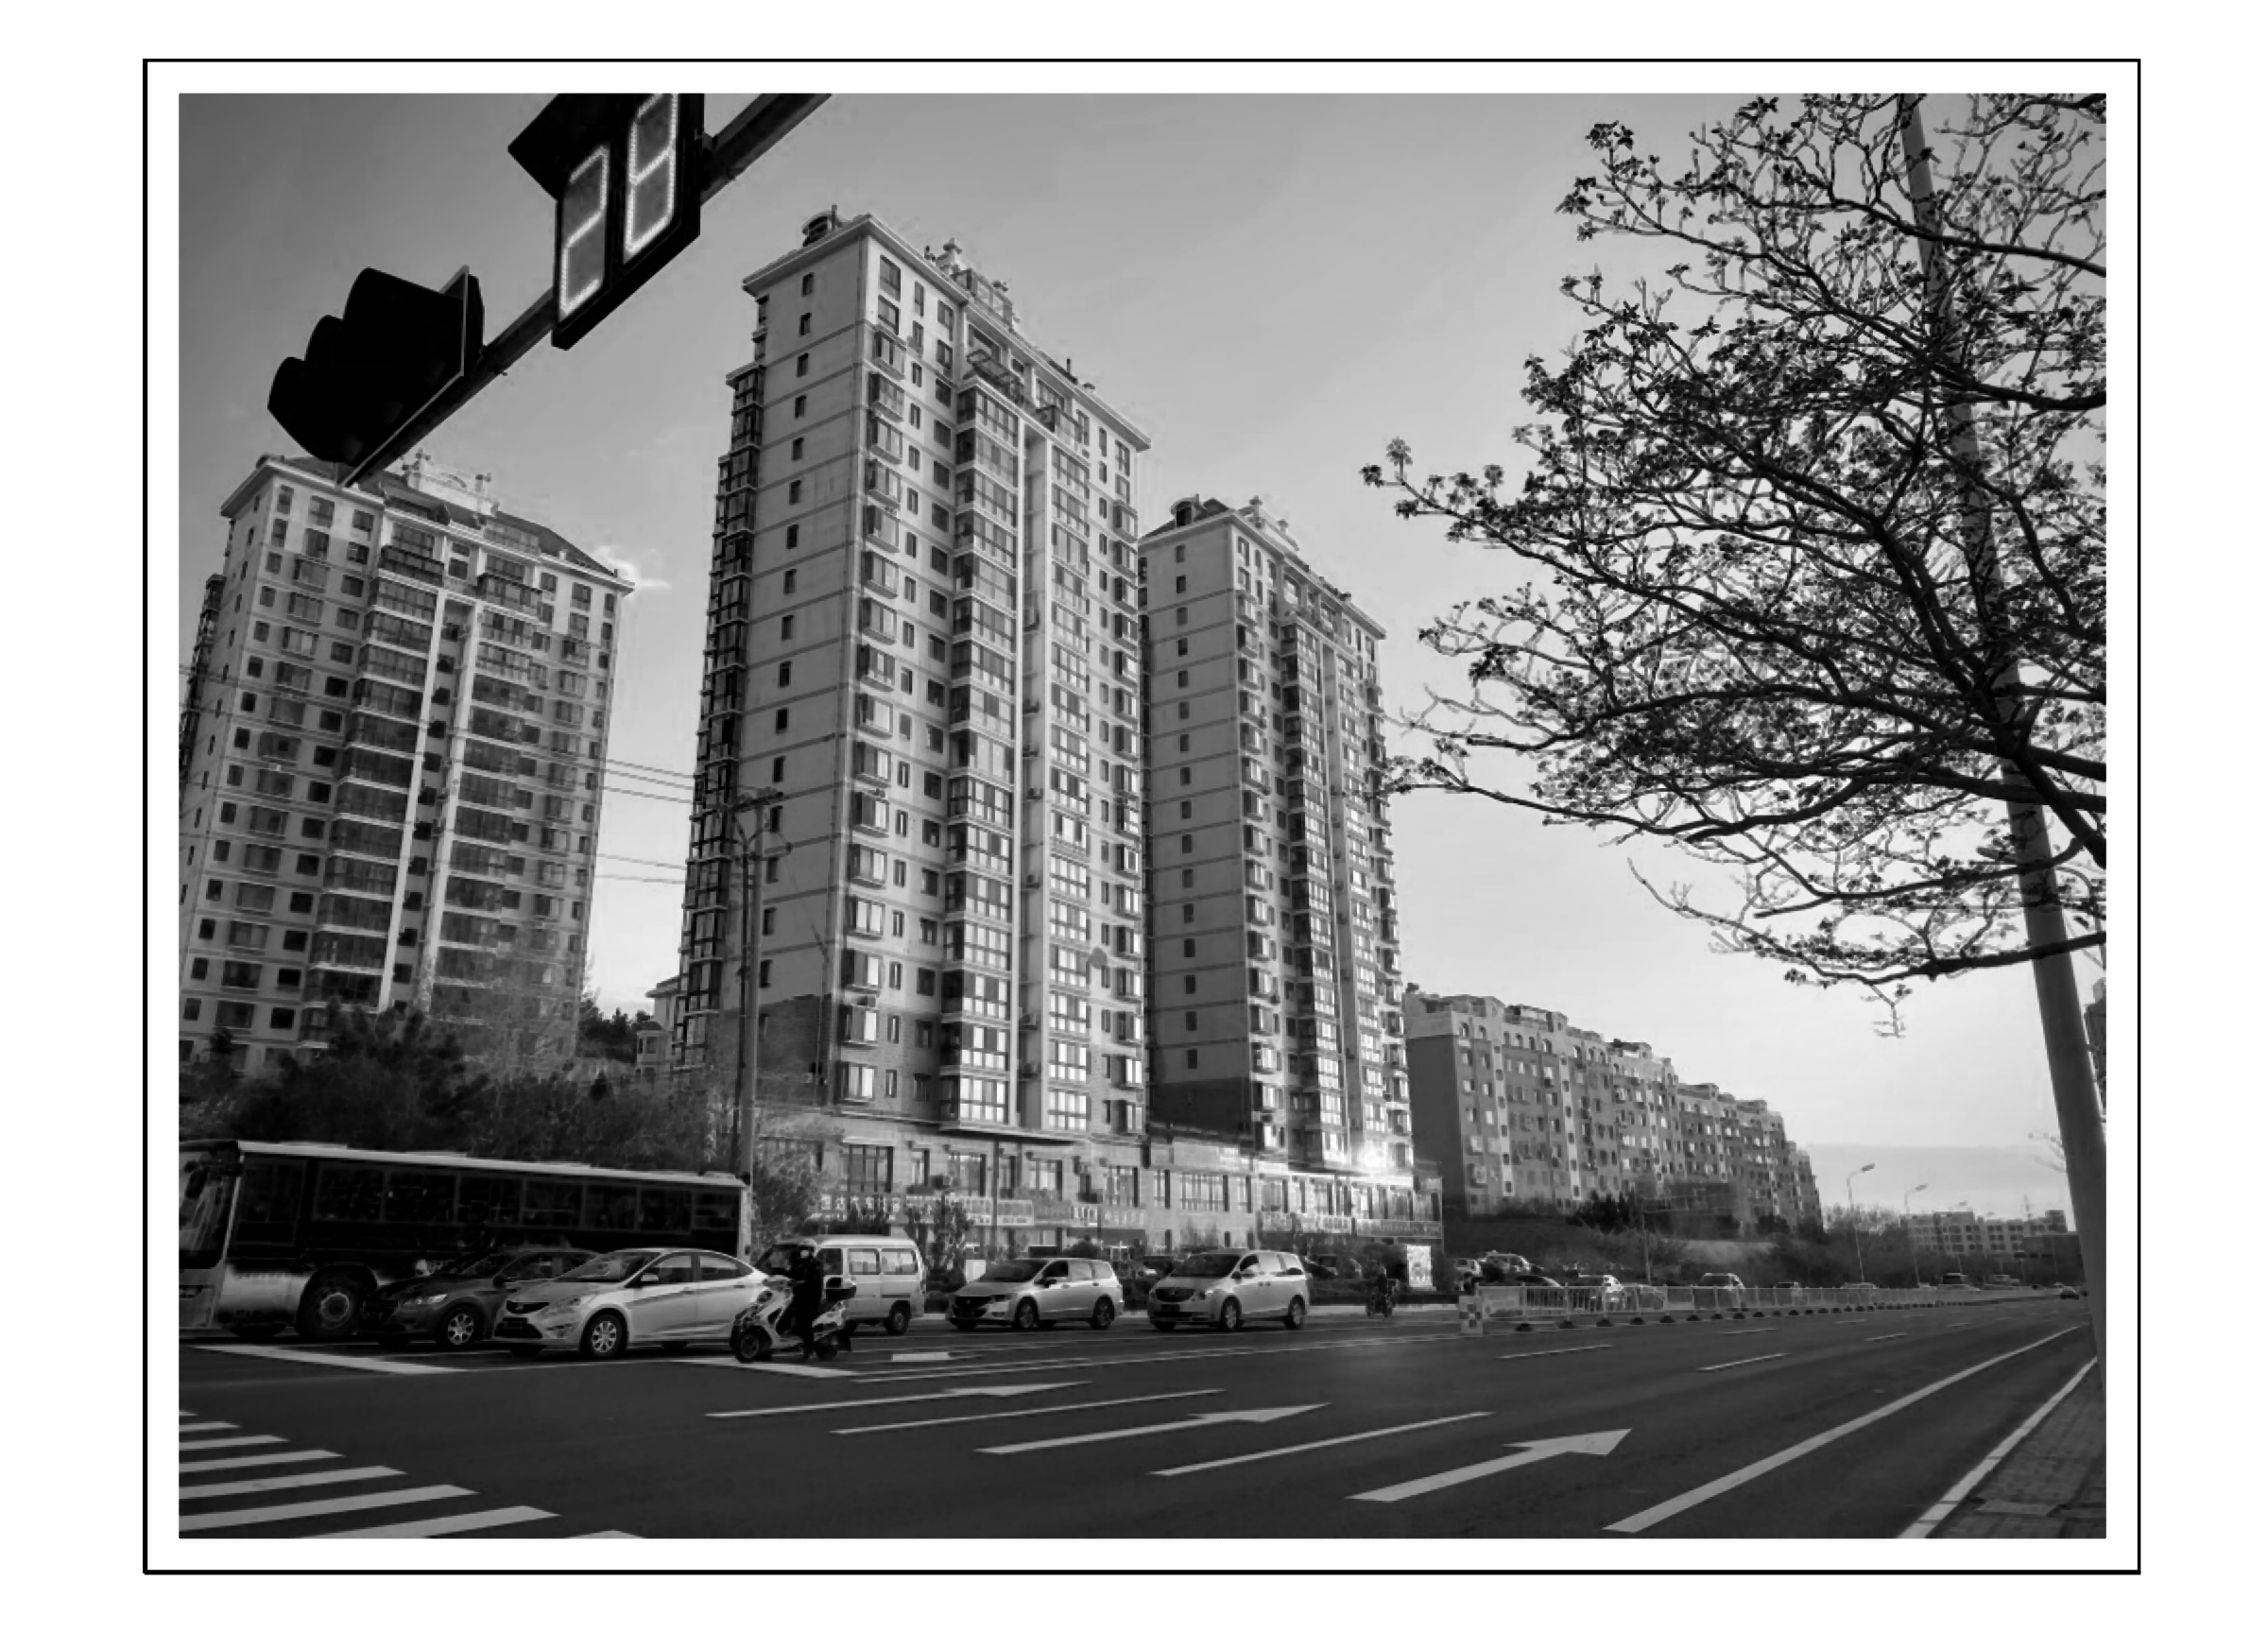
为了画出来一个精致的宝宝,我使用了 round(0.0001)(这个参数需要大家根据自己的电脑性能和等待忍受力选择)。这个时候 v 的取值就会很多,一行行的写绘图语句就不太可能了,可以通过循环构造绘图语句:
clear all import delimited photo.csv, clear retlist local nrow = r(N) local ncol = r(k) global aspectratio = `nrow' / `ncol' gen row = _n order row gather v* ren variable col replace col = subinstr(col, "v", "", .) destring col, replace ren value v
replace v = 1 - v gen v1 = string(round(v, 0.0001), "%6.4f") save photodata2, replace
use photodata2, clear replace row = -row local cmd = "tw" levelsof v1, local(vlist) foreach vn in`vlist' { if"`vn'" != "1.0000"local cmd = `"`cmd' (sc row col if v1 == "`vn'", msize(vtiny) mc(black*`vn'))"' if"`vn'" == "1.0000"local cmd = `"`cmd' (sc row col if v1 == "`vn'", msize(vtiny) mc(black))"' }
local RGBlist = "R G B" forval i = 1/3{ import delimited photo`i'.csv, clear local nrow = r(N) local ncol = r(k) global aspectratio = `nrow' / `ncol' gen row = _n gather v* ren variable col replace col = subinstr(col, "v", "", .) destring col, replace replace value = round(v, 0.1) local a: word `i' of `RGBlist' ren value `a' replace`a' = int(R * 255) save`a', replace }
use R, clear merge 1:1 row col using G drop _m merge 1:1 row col using B drop _m
unite R G B, gen(RGB) sep(" ") drop R G B unique RGB
*> Number of unique values of RGB is 354 *> Number of records is 187500
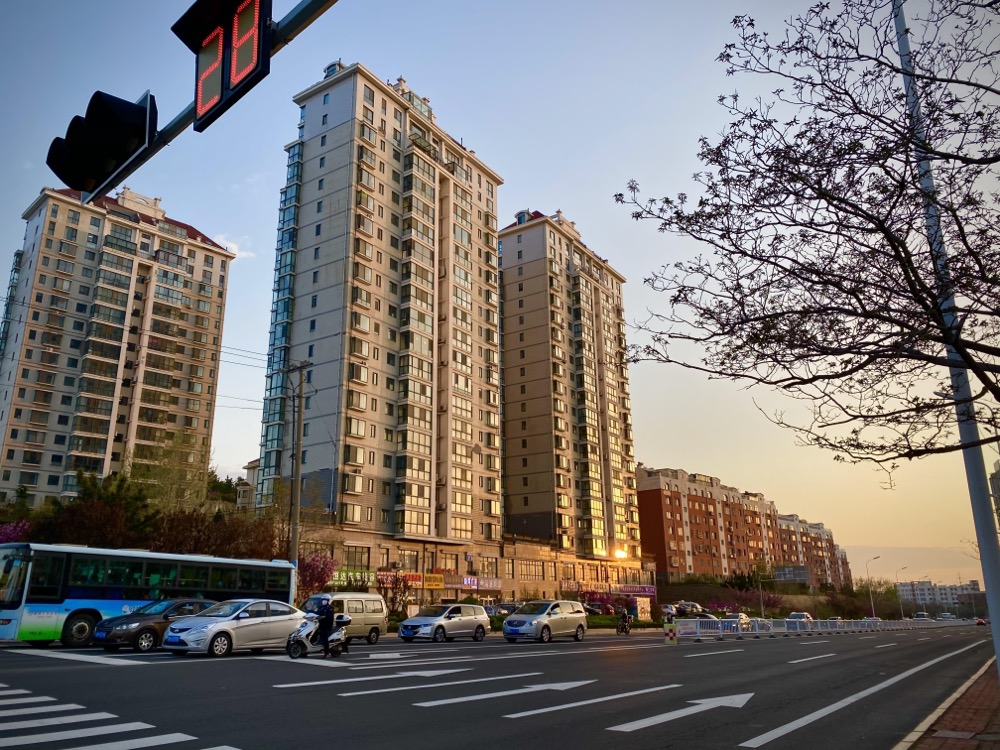
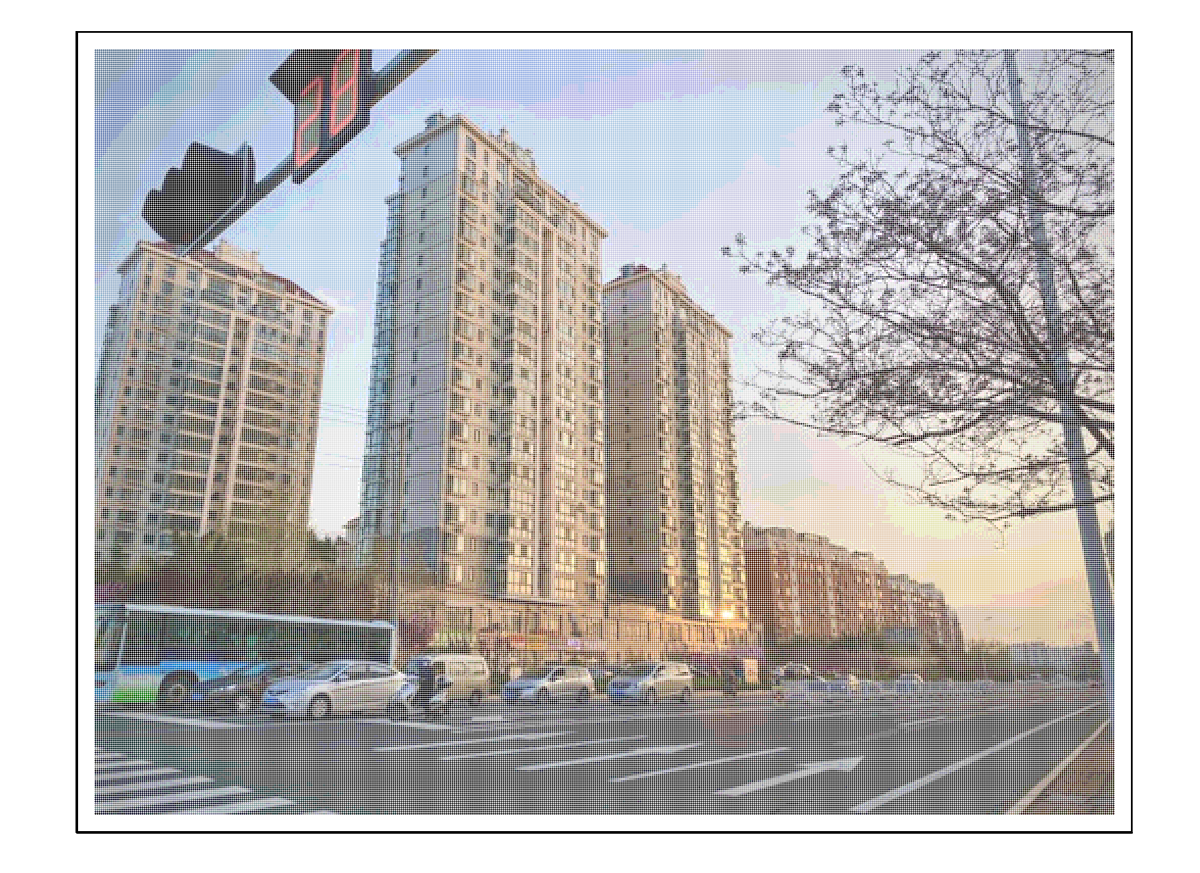
应用1: 如果你有个使用 Stata 的女(男)朋友,用 Stata 给她(他)绘制一幅肖像图,对他来说一定是个惊喜!
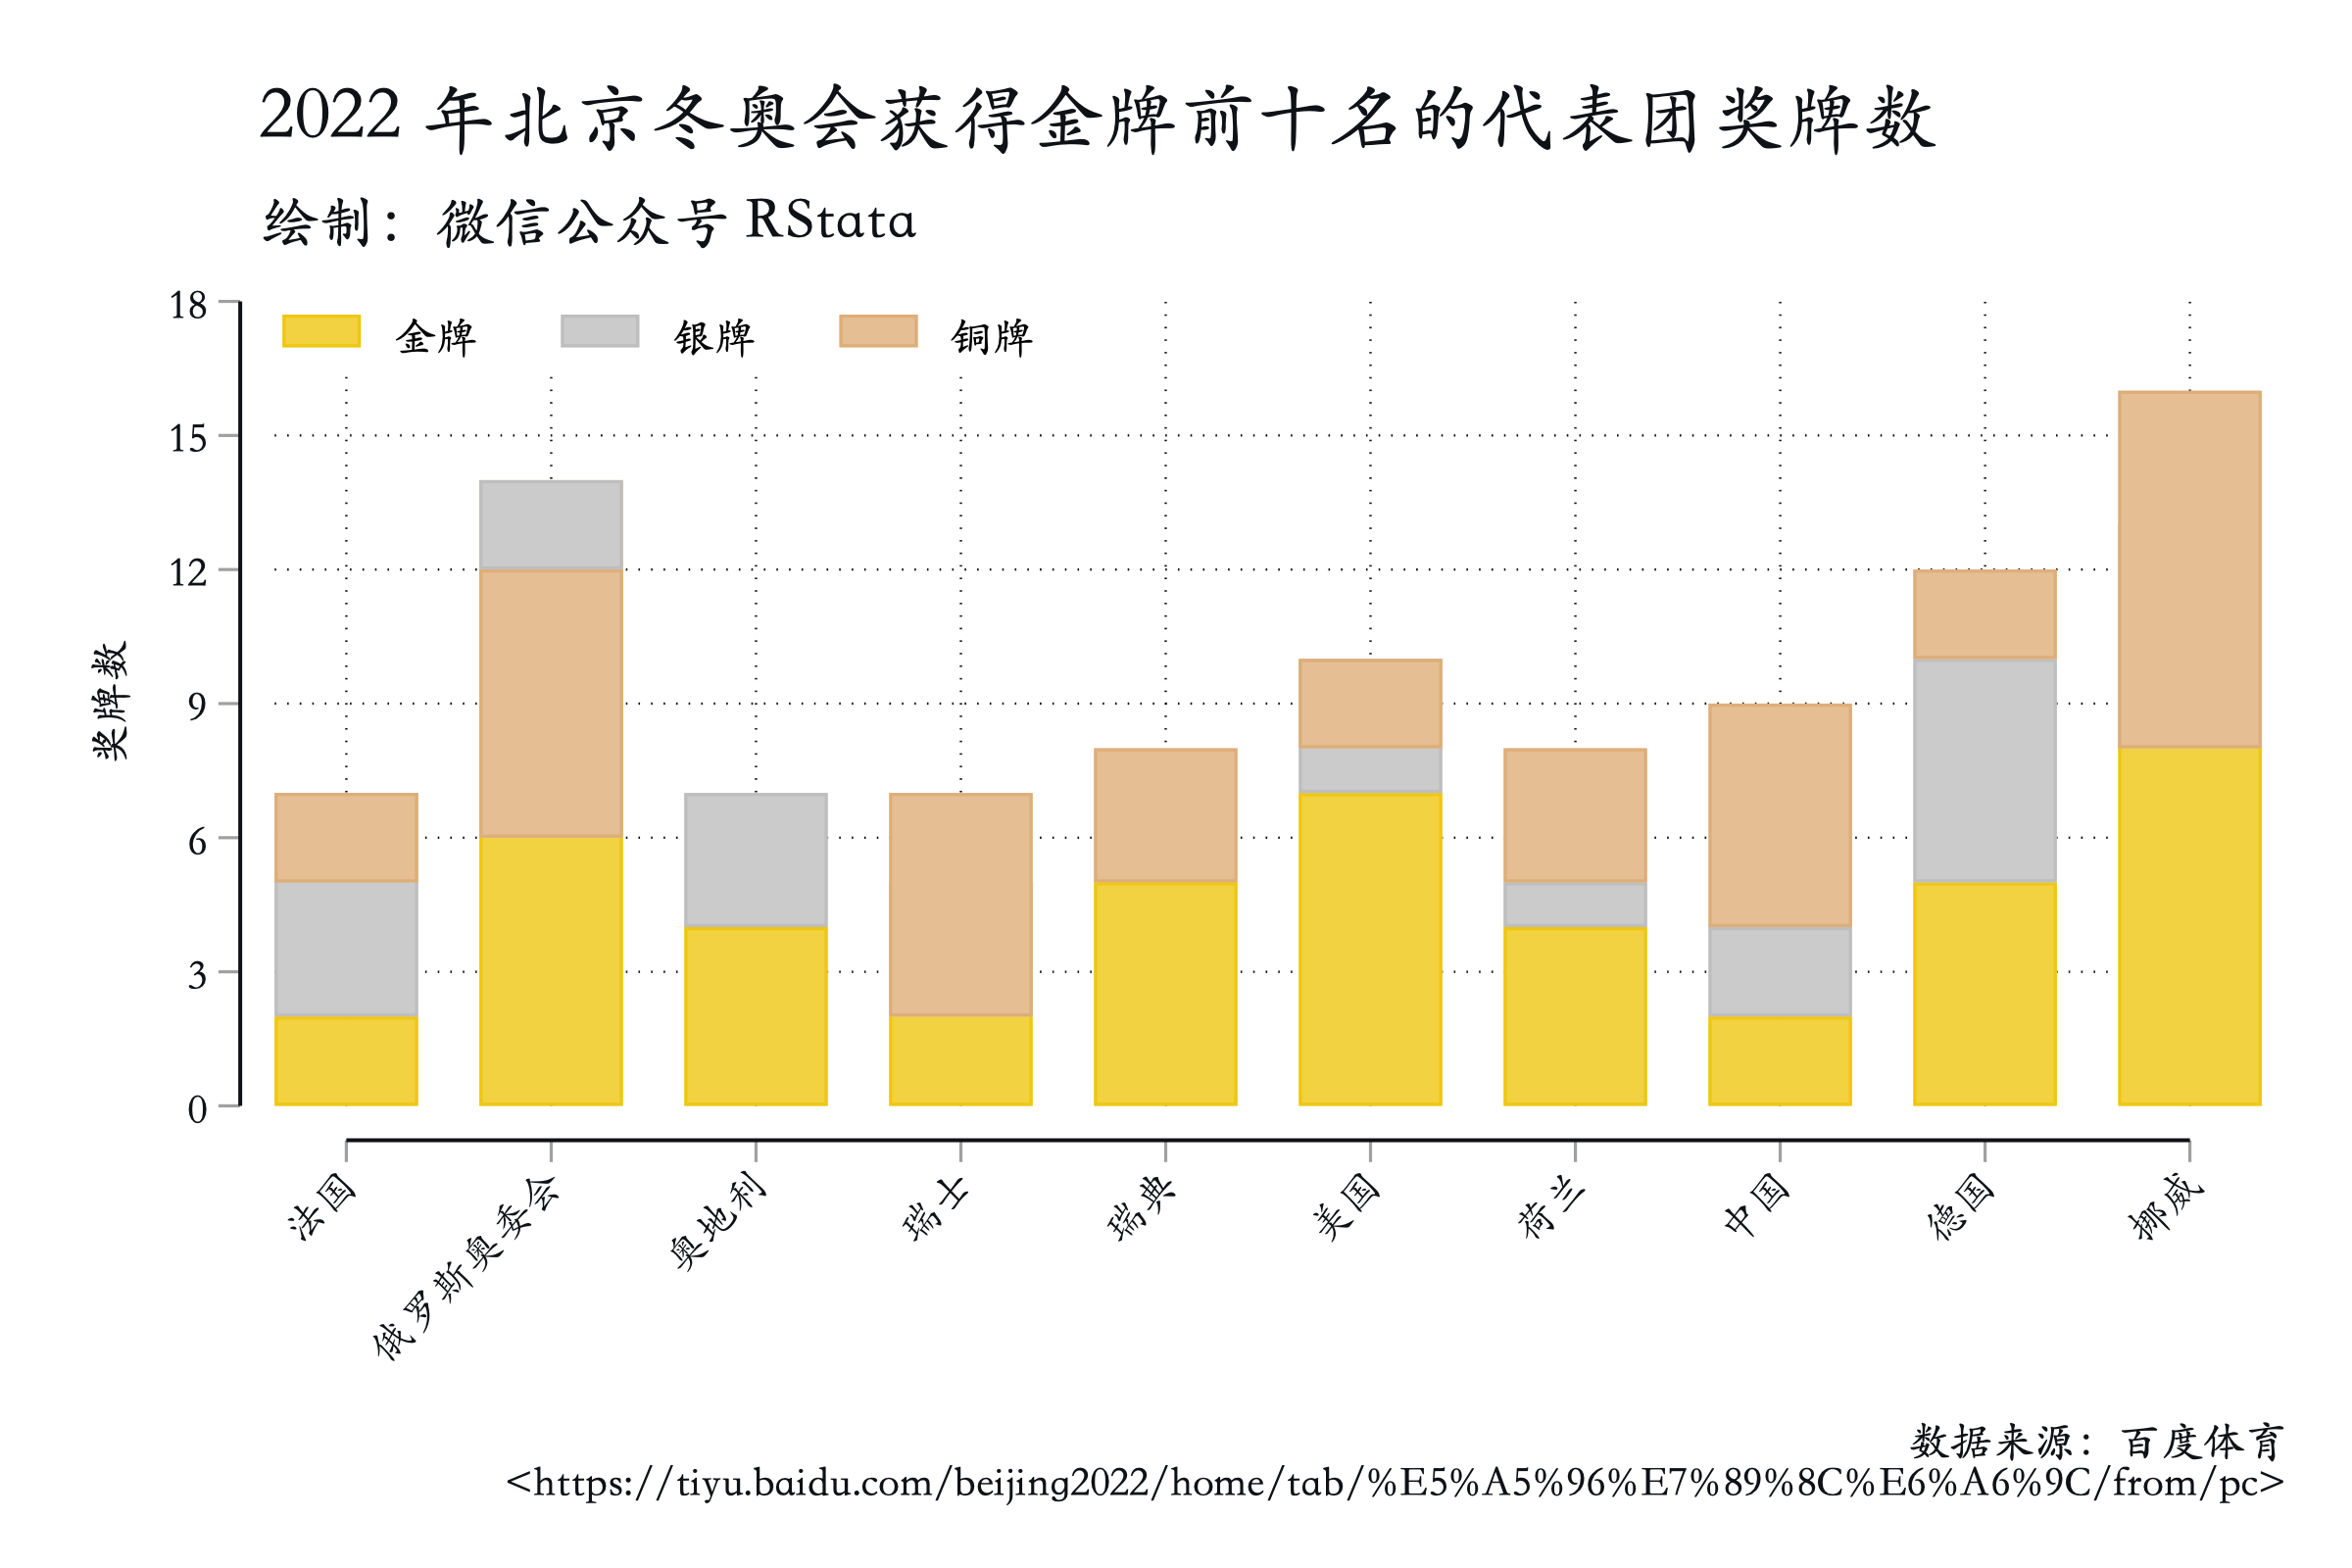
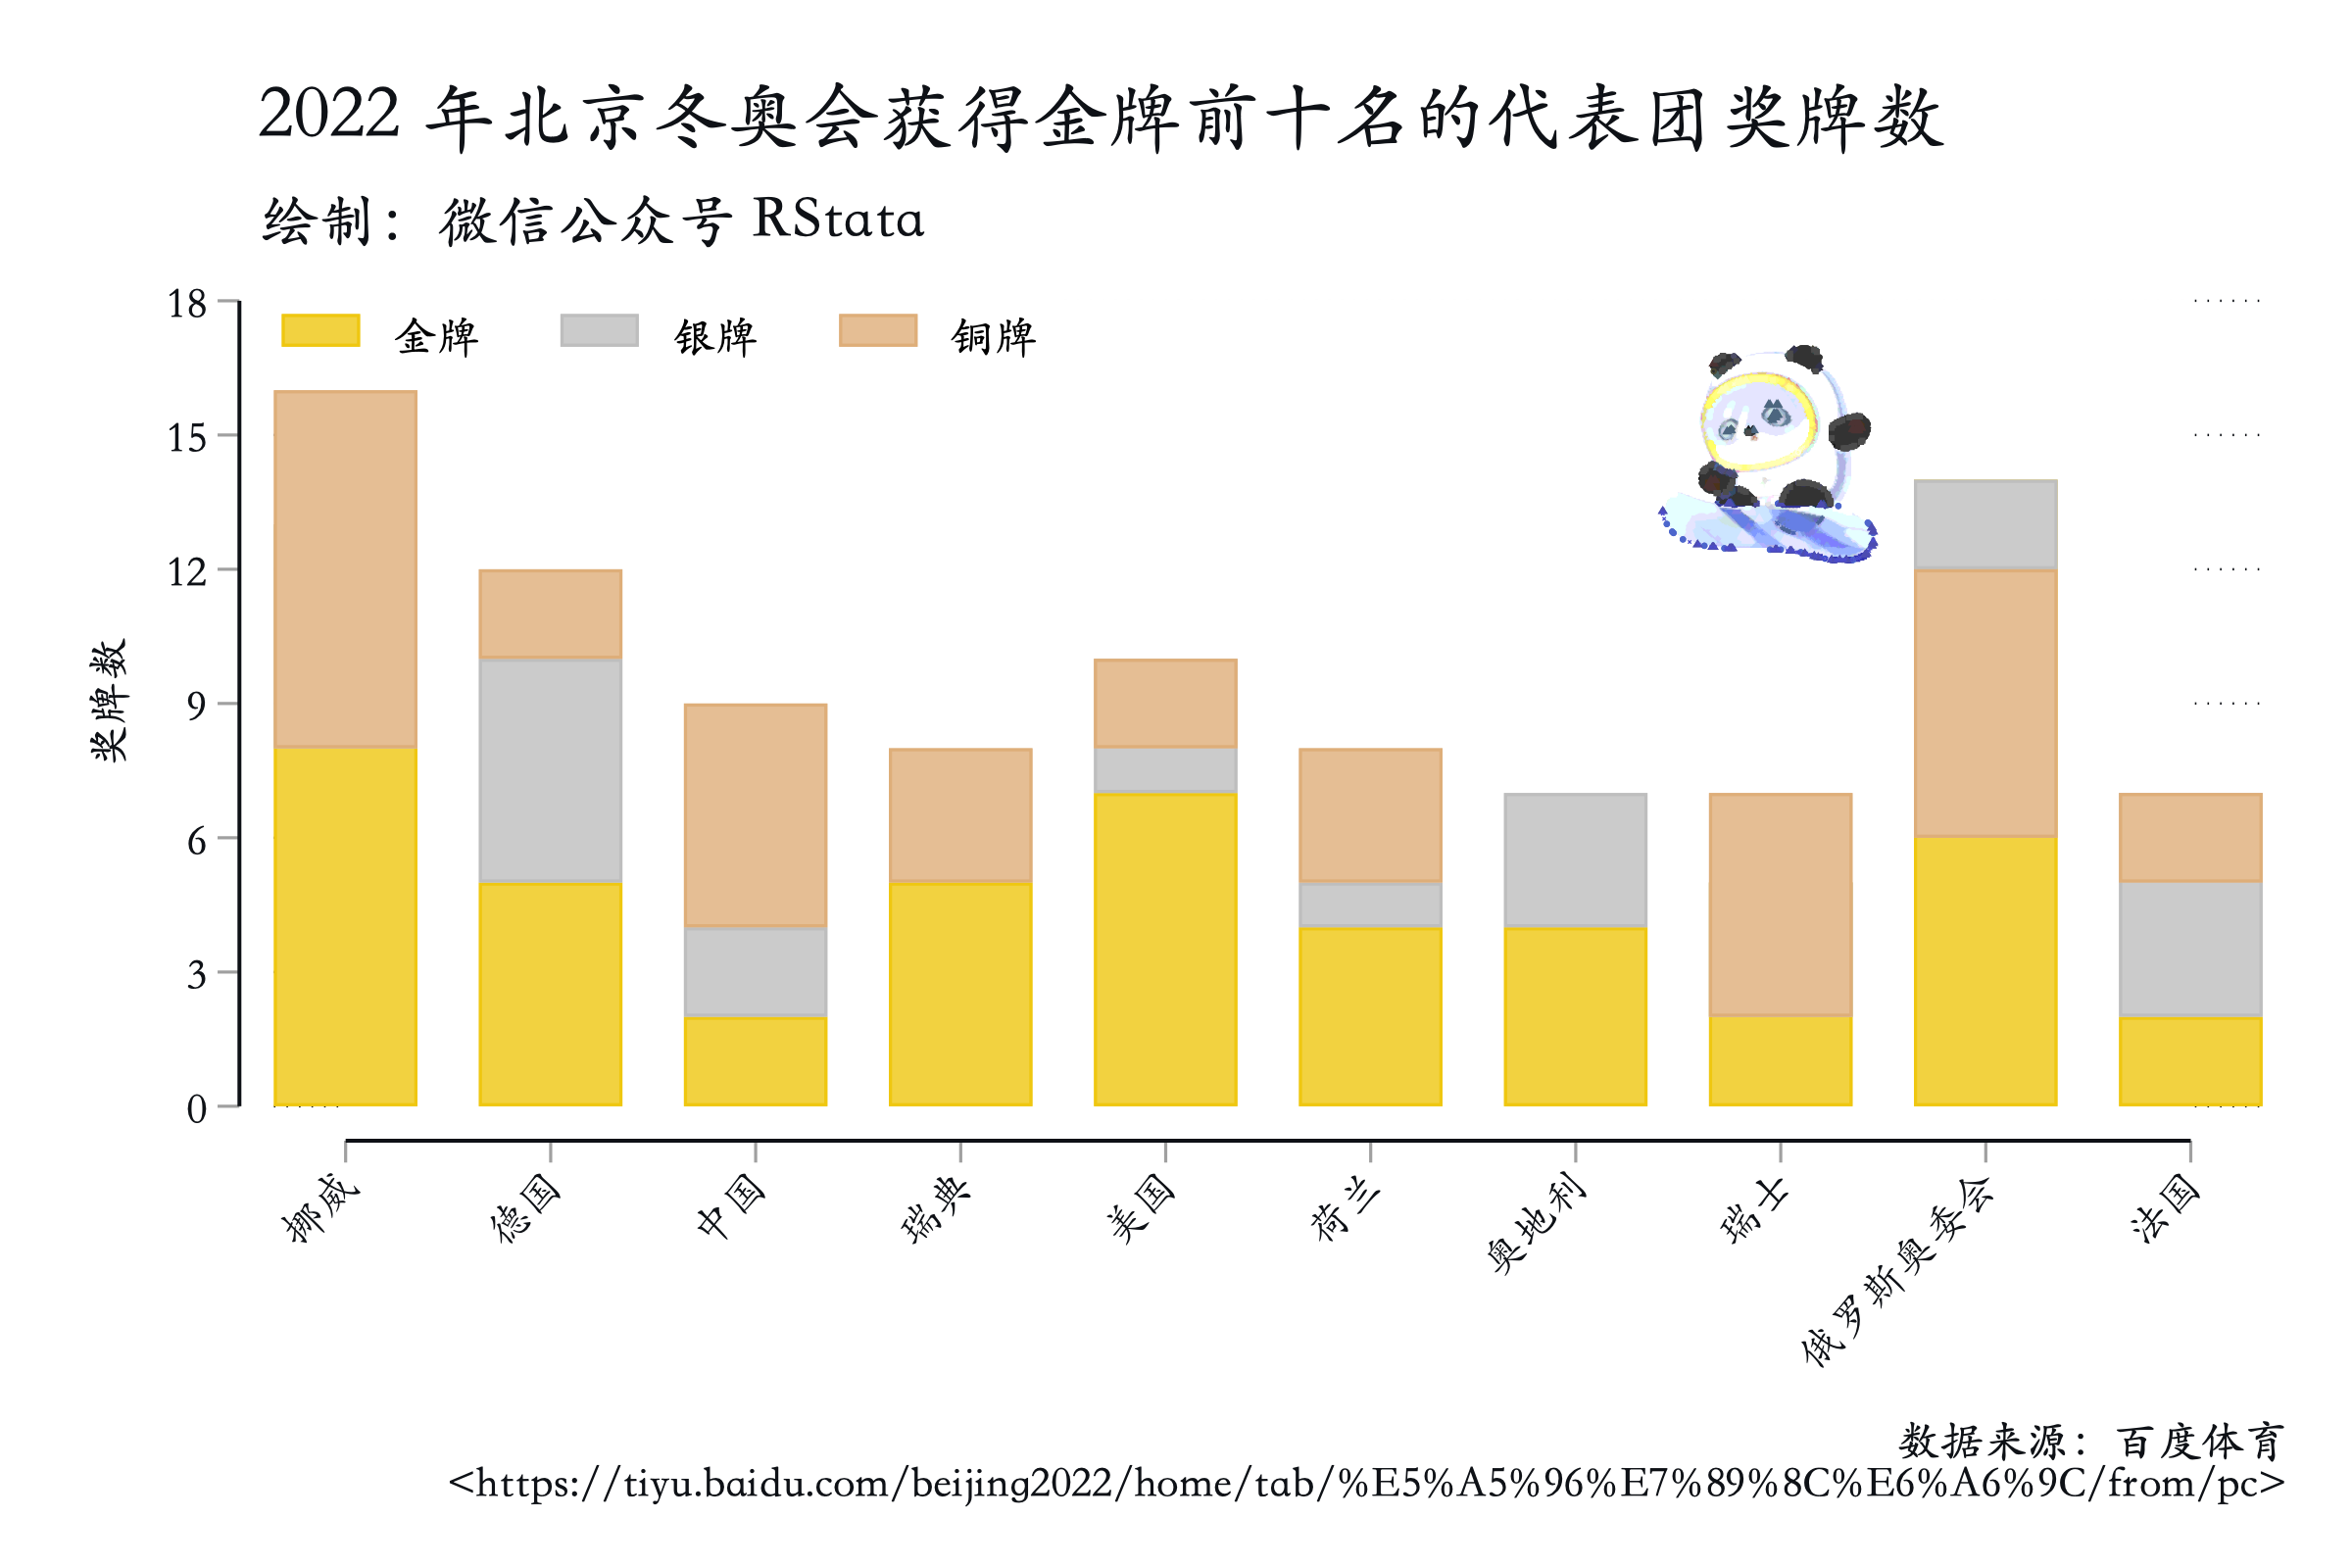
应用2: 给图表添加背景。
在 Stata 中完成一切
上面的代码中我们使用了 R 语言,这就很不方便了,那么我们能不能在 Stata 中完成整个过程呢?
借助 rcall 命令我们可以在 Stata 中运行 R 语言的代码,运行下面的代码安装 rcall(附件中有安装包):
net install rcall.pkg, from("rcall.pkg 所在的文件夹路径") replace
net install github.pkg, from("github.pkg 所在的文件夹路径") replace
rcall 命令会自动搜寻 R 软件的位置,所以大多数时候并不需要设置 R 的路径,如果 rcall 找不到(使用 rcall 的时候会提示,当然你得先确保你安装了 R 软件):
rcall setpath "/usr/local/bin/R"
注意这里的 “/usr/local/bin/R” 要替换成你自己电脑上的 R 运行路径,如果是 Mac 电脑,可以打开终端(电脑上的一个软件),运行 which R 查看该路径,如果是 Windows 电脑,该路径是 R 安装目录文件夹里面的 exe 文件的完整路径,类似 “C:/Program Files/R/R-3.5.3/R.exe”
*! 使用 Stata 绘制图片 *! 微信公众号 RStata *!2022 年 3 月 3 日 capture program drop plotphoto program define plotphoto, rclass syntax anything(name = img)[, Plot] di "处理图片中......" qui{ if index("`img'","jpg")| index("`img'","jpeg")| index("`img'","JPG")| index("`img'","JPEG"){ rcall:/// df <- jpeg::readJPEG("`img'"); /// for(v in1:3){/// df[1:dim(df)[1],1:dim(df)[2], v]%>%/// as_tibble()%>%/// readr::write_csv(paste0("photo", v,".csv"))/// } } if index("`img'","png")| index("`img'","PNG"){ rcall:/// df <- png::readPNG("`img'"); /// for(v in1:3){/// df[1:dim(df)[1],1:dim(df)[2], v]%>%/// as_tibble()%>%/// readr::write_csv(paste0("photo", v,".csv"))/// } }
local RGBlist ="R G B" forval i =1/3{ import delimited photo`i'.csv, clear local nrow = r(N) ret local nrow = `nrow' local ncol = r(k) ret local ncol = `ncol' local aspectratio = `nrow' / `ncol' ret local aspectratio = `aspectratio' gen row = _n gather v* ren variable col replace col = subinstr(col,"v","", .) destring col, replace replace value =round(v,0.1) local a: word `i' of `RGBlist' ren value `a' replace `a' = int(`a' * 255) save `a', replace }
use R, clear merge 1:1 row col using G drop _m merge 1:1 row col using B drop _m unite R G B, gen(RGB) sep(" ") drop R G B replace row =-row } if"`plot'"!=""{ di "绘图中......" qui { local cmd ="tw"
qui levelsof RGB, local(RGB) foreach vn in `RGB' { local cmd = `"`cmd' (sc row col if RGB == "`vn'", msize(vtiny) mc("`vn'"))"' } di `"`cmd'"'





评论