ggplot2 包自带了很多图层,基本可以满足我们的各种绘图需要,但是有时候我们需要绘制一些“古怪”的图,就需要使用一些 ggplot2 的拓展包了,本文将介绍一些好用的 ggplot2 拓展包。
加载 R 包
library(tidyverse)
library(wesanderson)
|
wesanderson 包里面提供了很多好看的调色板。
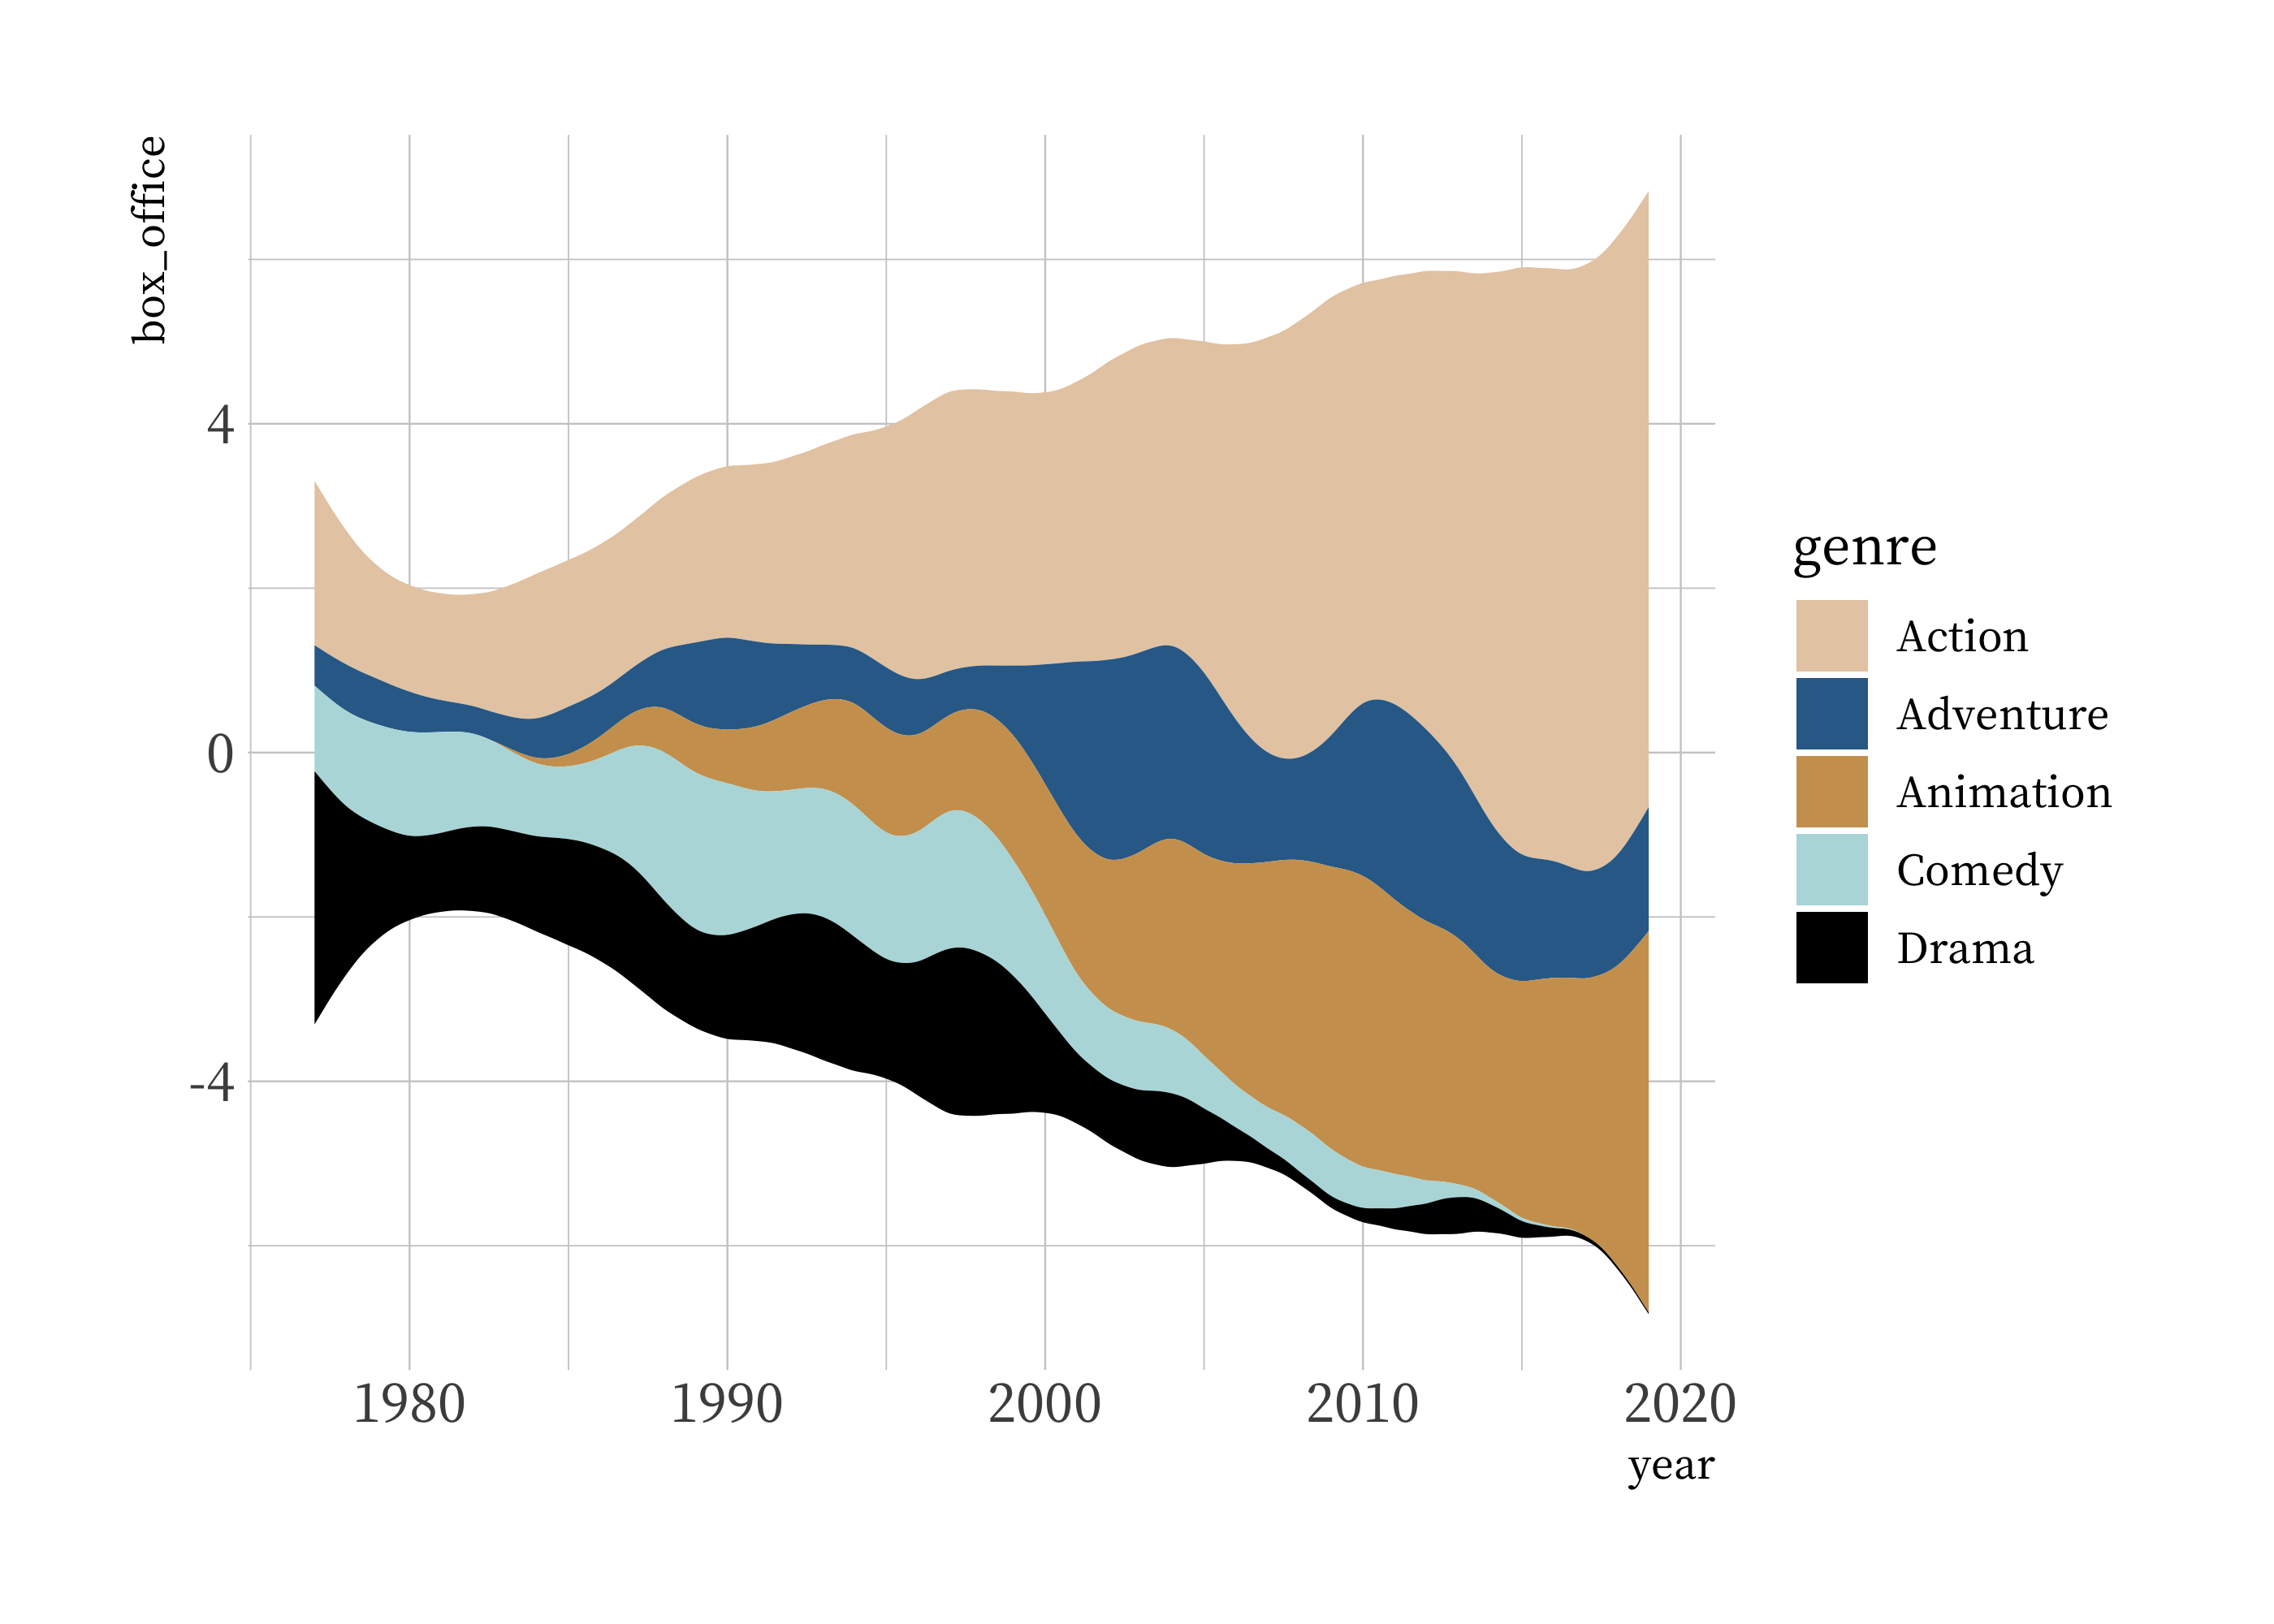
流图:geom_stream()
library(ggstream)
blockbusters
ggplot(blockbusters, aes(year, box_office, fill = genre)) +
geom_stream() +
scale_fill_manual(values = wes_palette("Darjeeling2"))
|
| 流图:geom_stream() |
 |
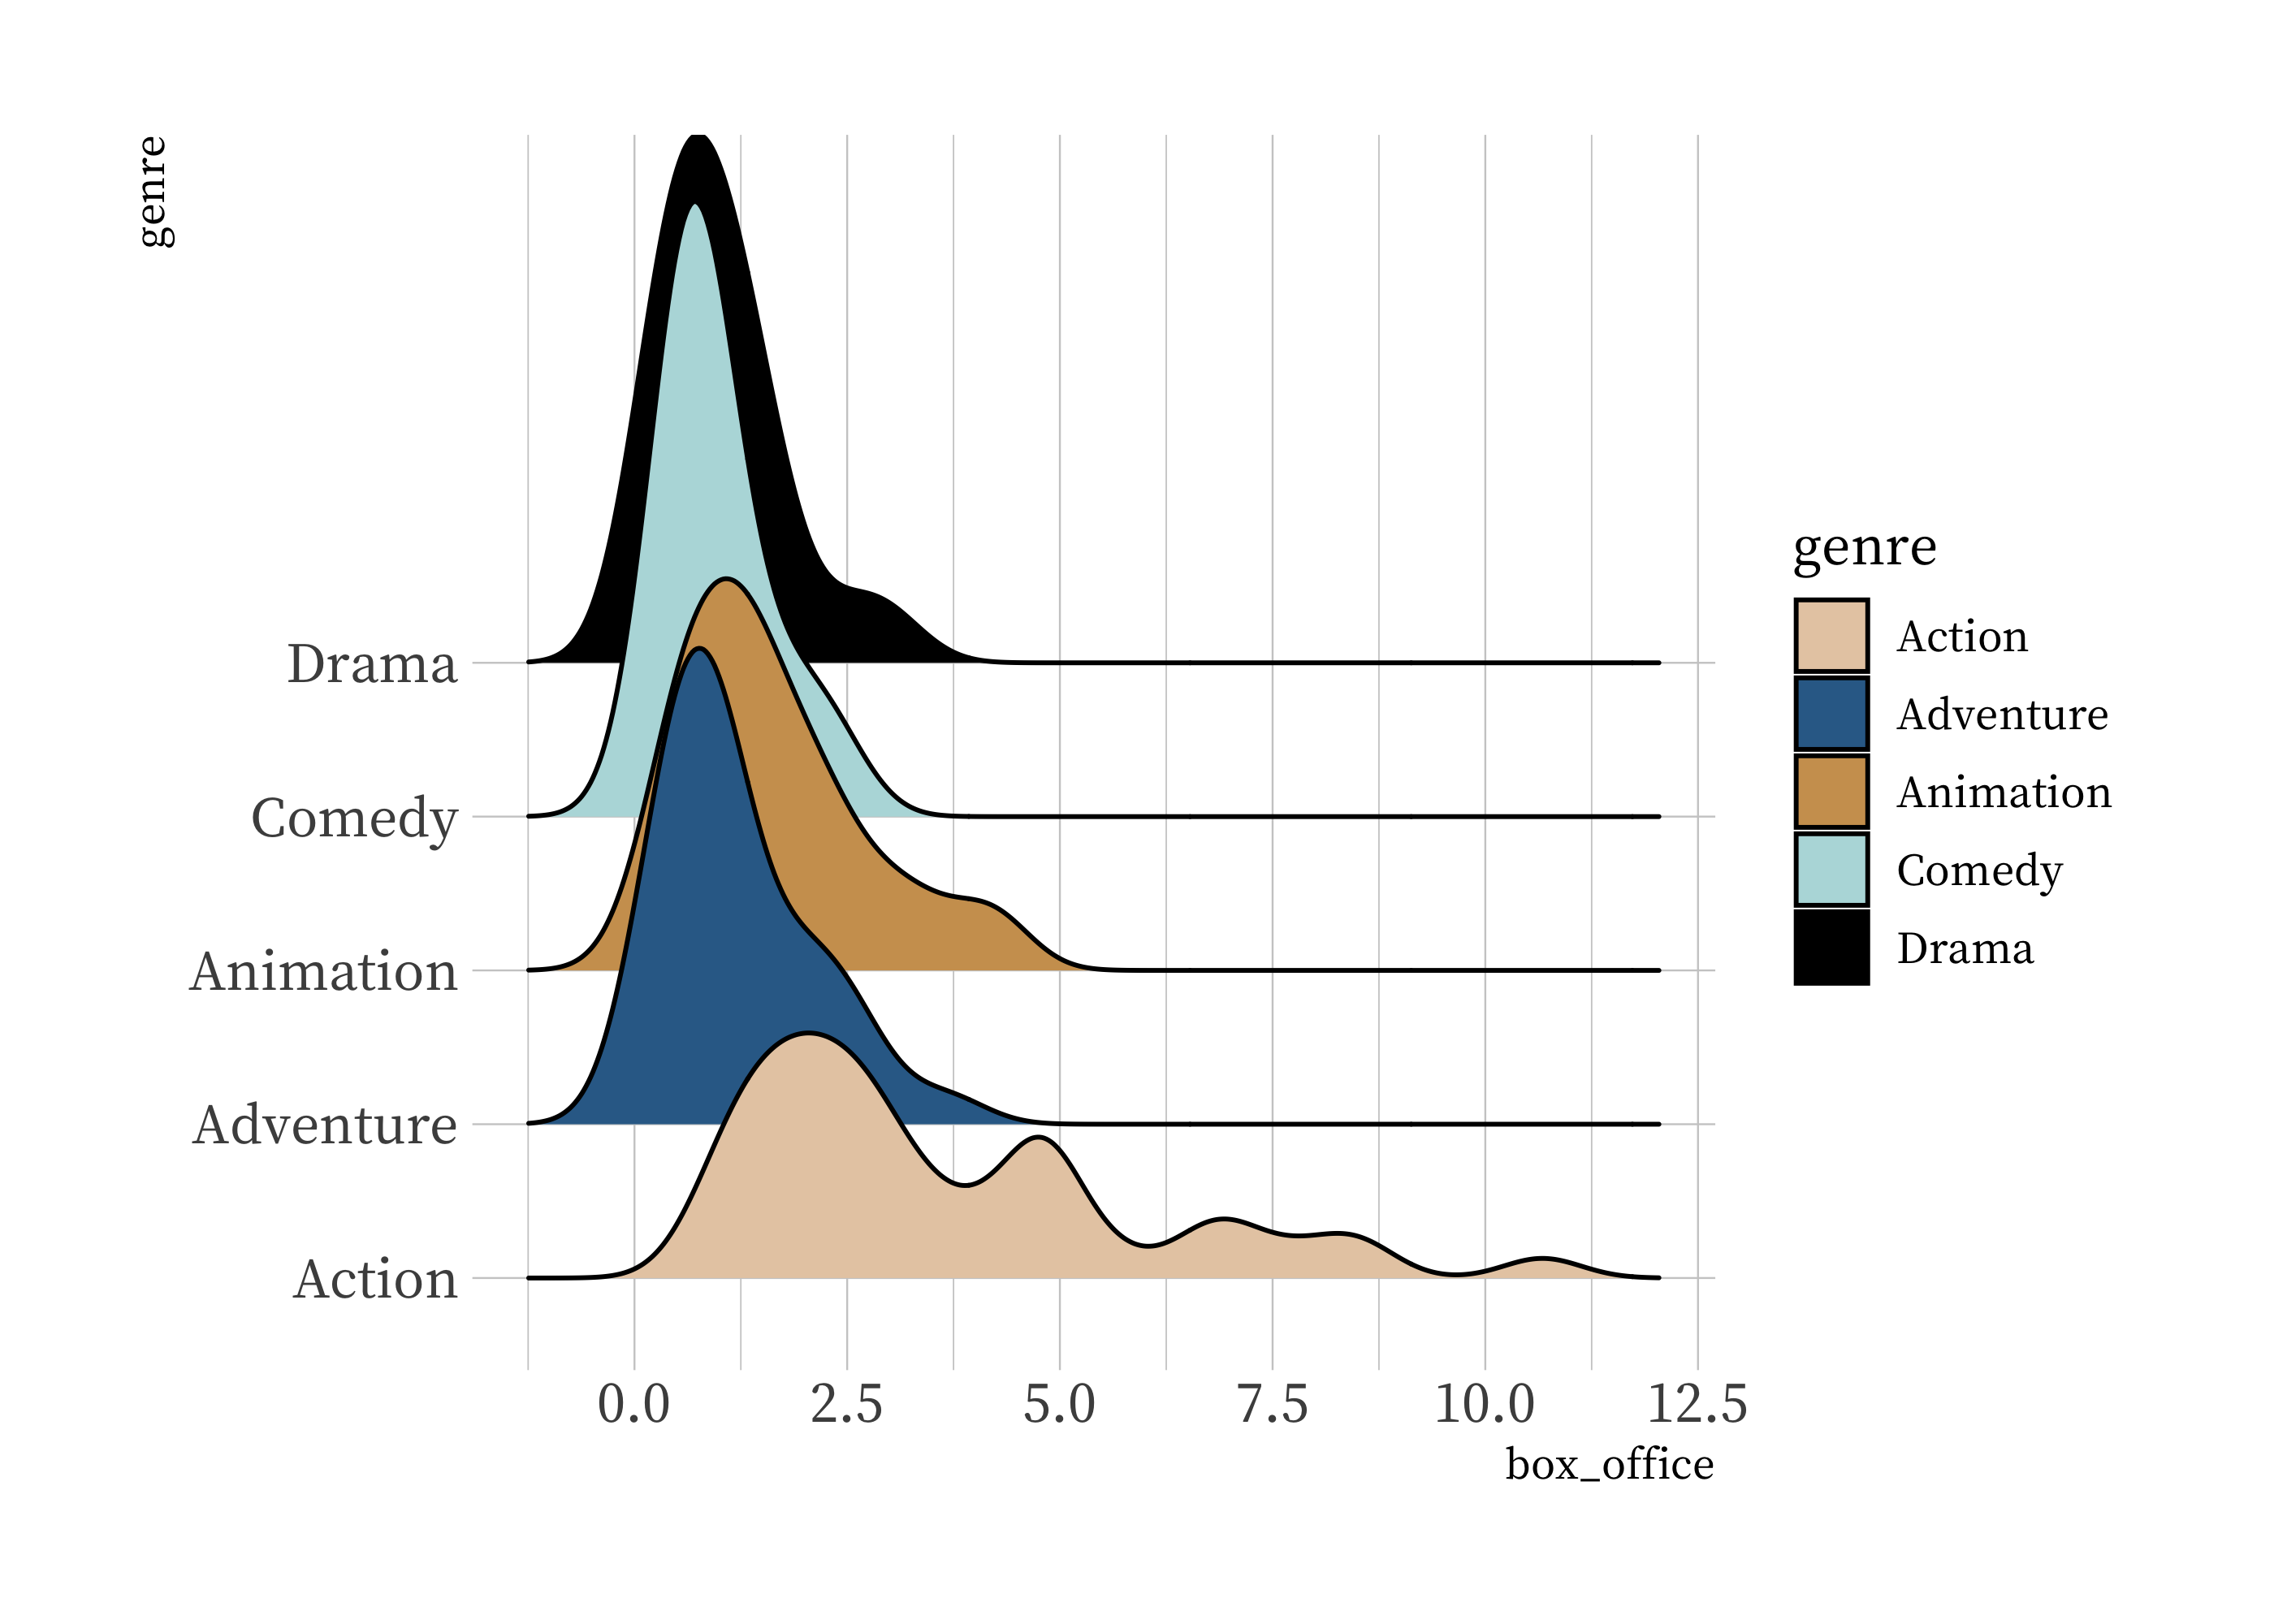
山岭图:geom_density_ridges()
library(ggridges)
ggplot(blockbusters, aes(x = box_office, y = genre, fill = genre)) +
geom_density_ridges(scale = 4) +
scale_fill_manual(values = wes_palette("Darjeeling2", n = 5))
|
| 流图:geom_stream() |
 |
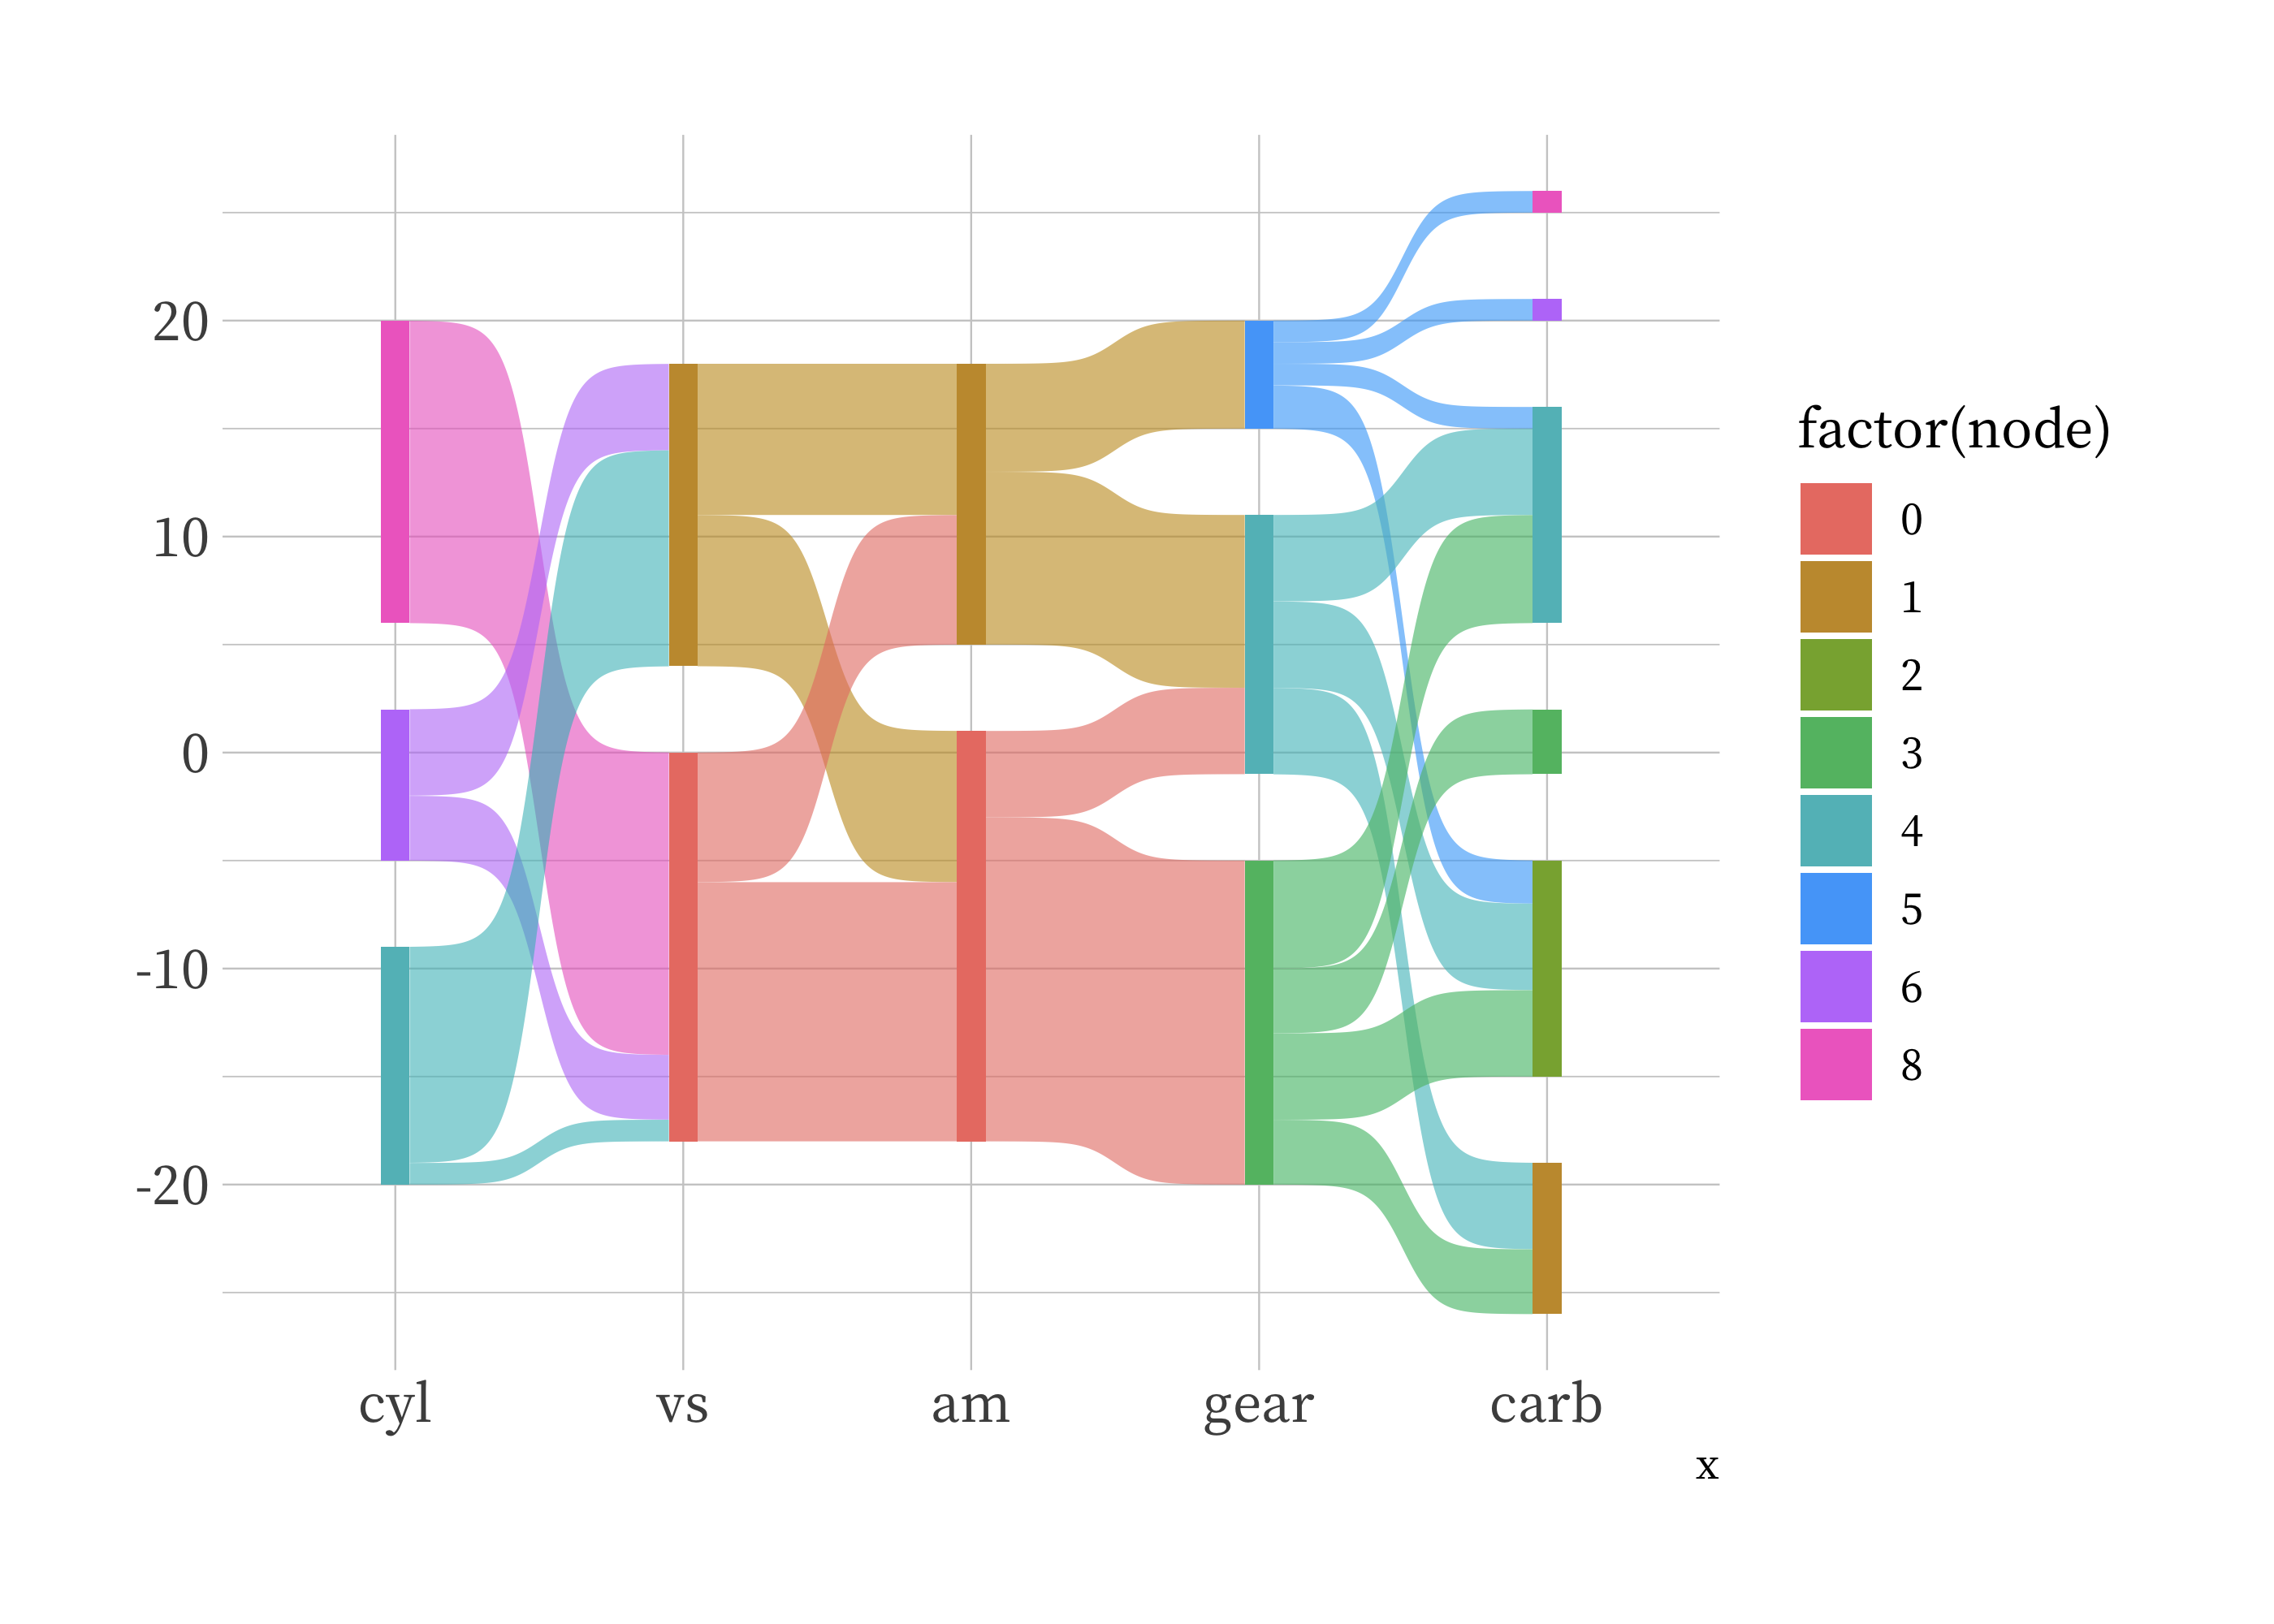
桑基图:geom_sankey()
library(ggsankey)
mtcars %>%
as_tibble()
mtcars %>%
make_long(cyl, vs, am, gear, carb) -> example_dat
example_dat %>%
as_tibble()
ggplot(example_dat,
aes(x = x,
next_x = next_x,
node = node,
next_node = next_node,
fill = factor(node))) +
geom_sankey(flow.alpha = 0.6)
|
| 桑基图:geom_sankey() |
 |
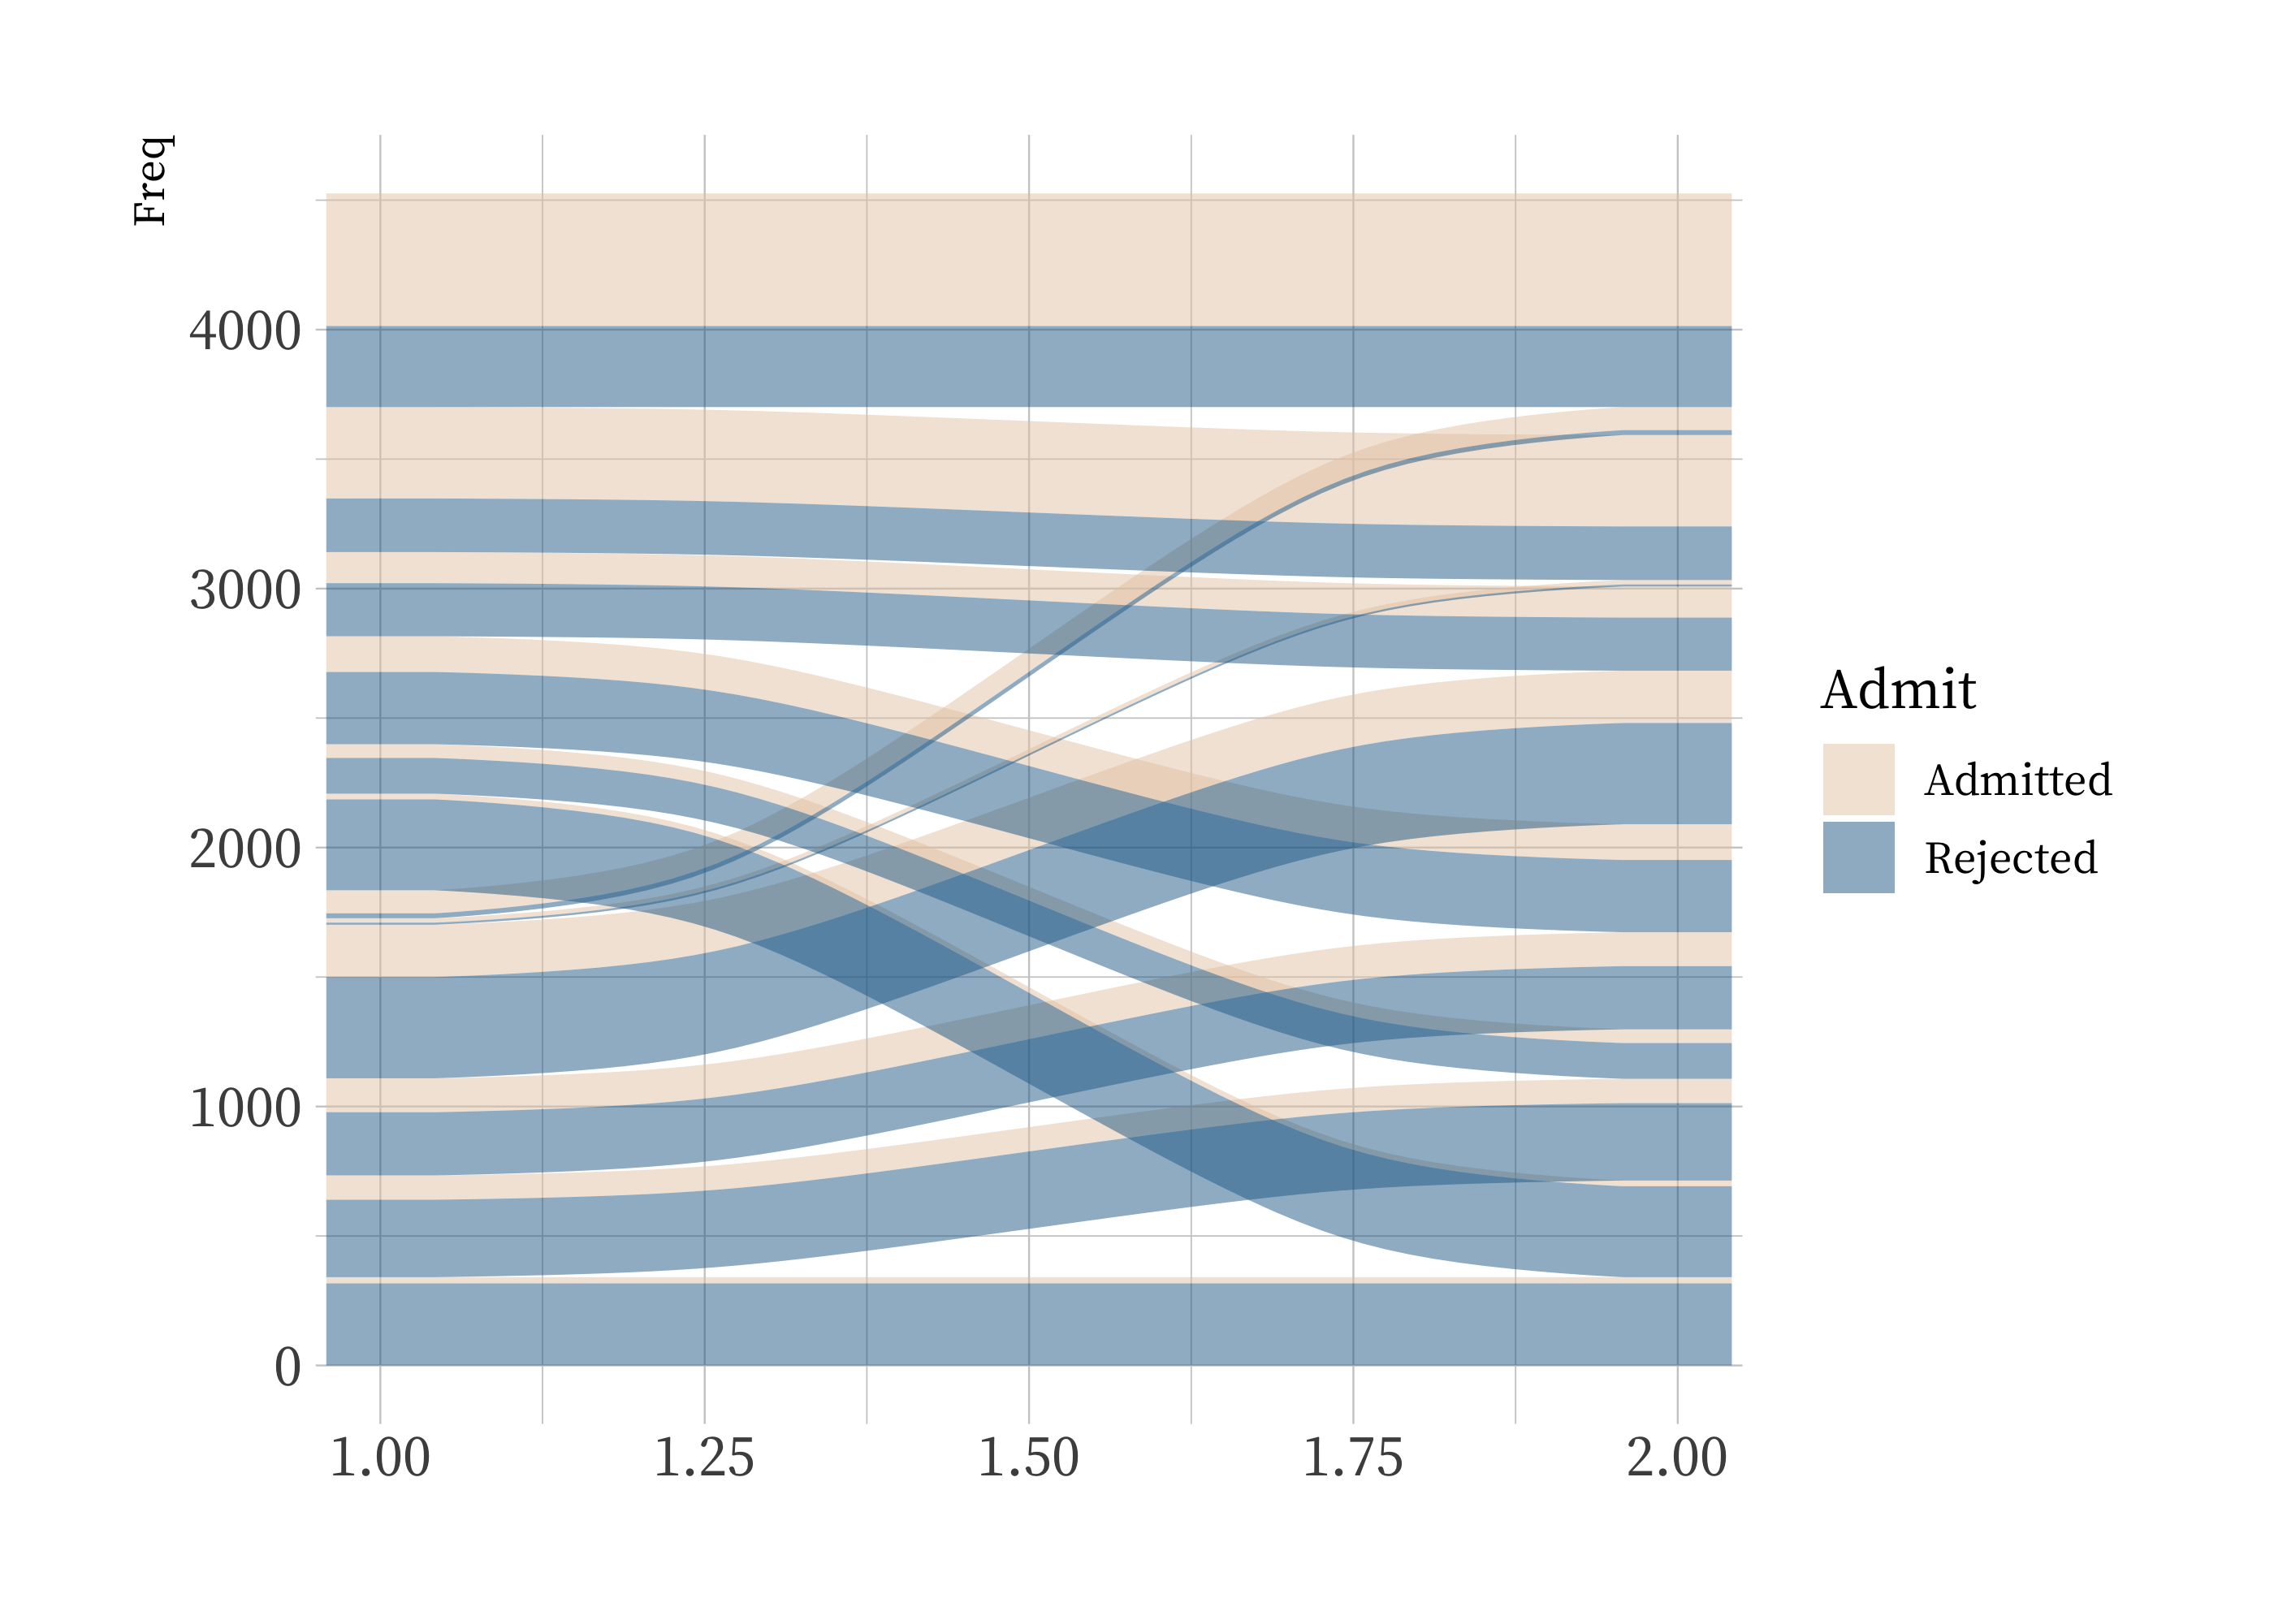
另一个用来绘制冲积图的包是 ggalluvial 包:
library(ggalluvial)
ggplot(as.data.frame(UCBAdmissions),
aes(y = Freq, axis1 = Gender, axis2 = Dept)) +
geom_alluvium(aes(fill = Admit), width = 1/12) +
scale_fill_manual(values = wes_palette("Darjeeling2"))
|
| 桑基图:ggalluvial 包 |
 |
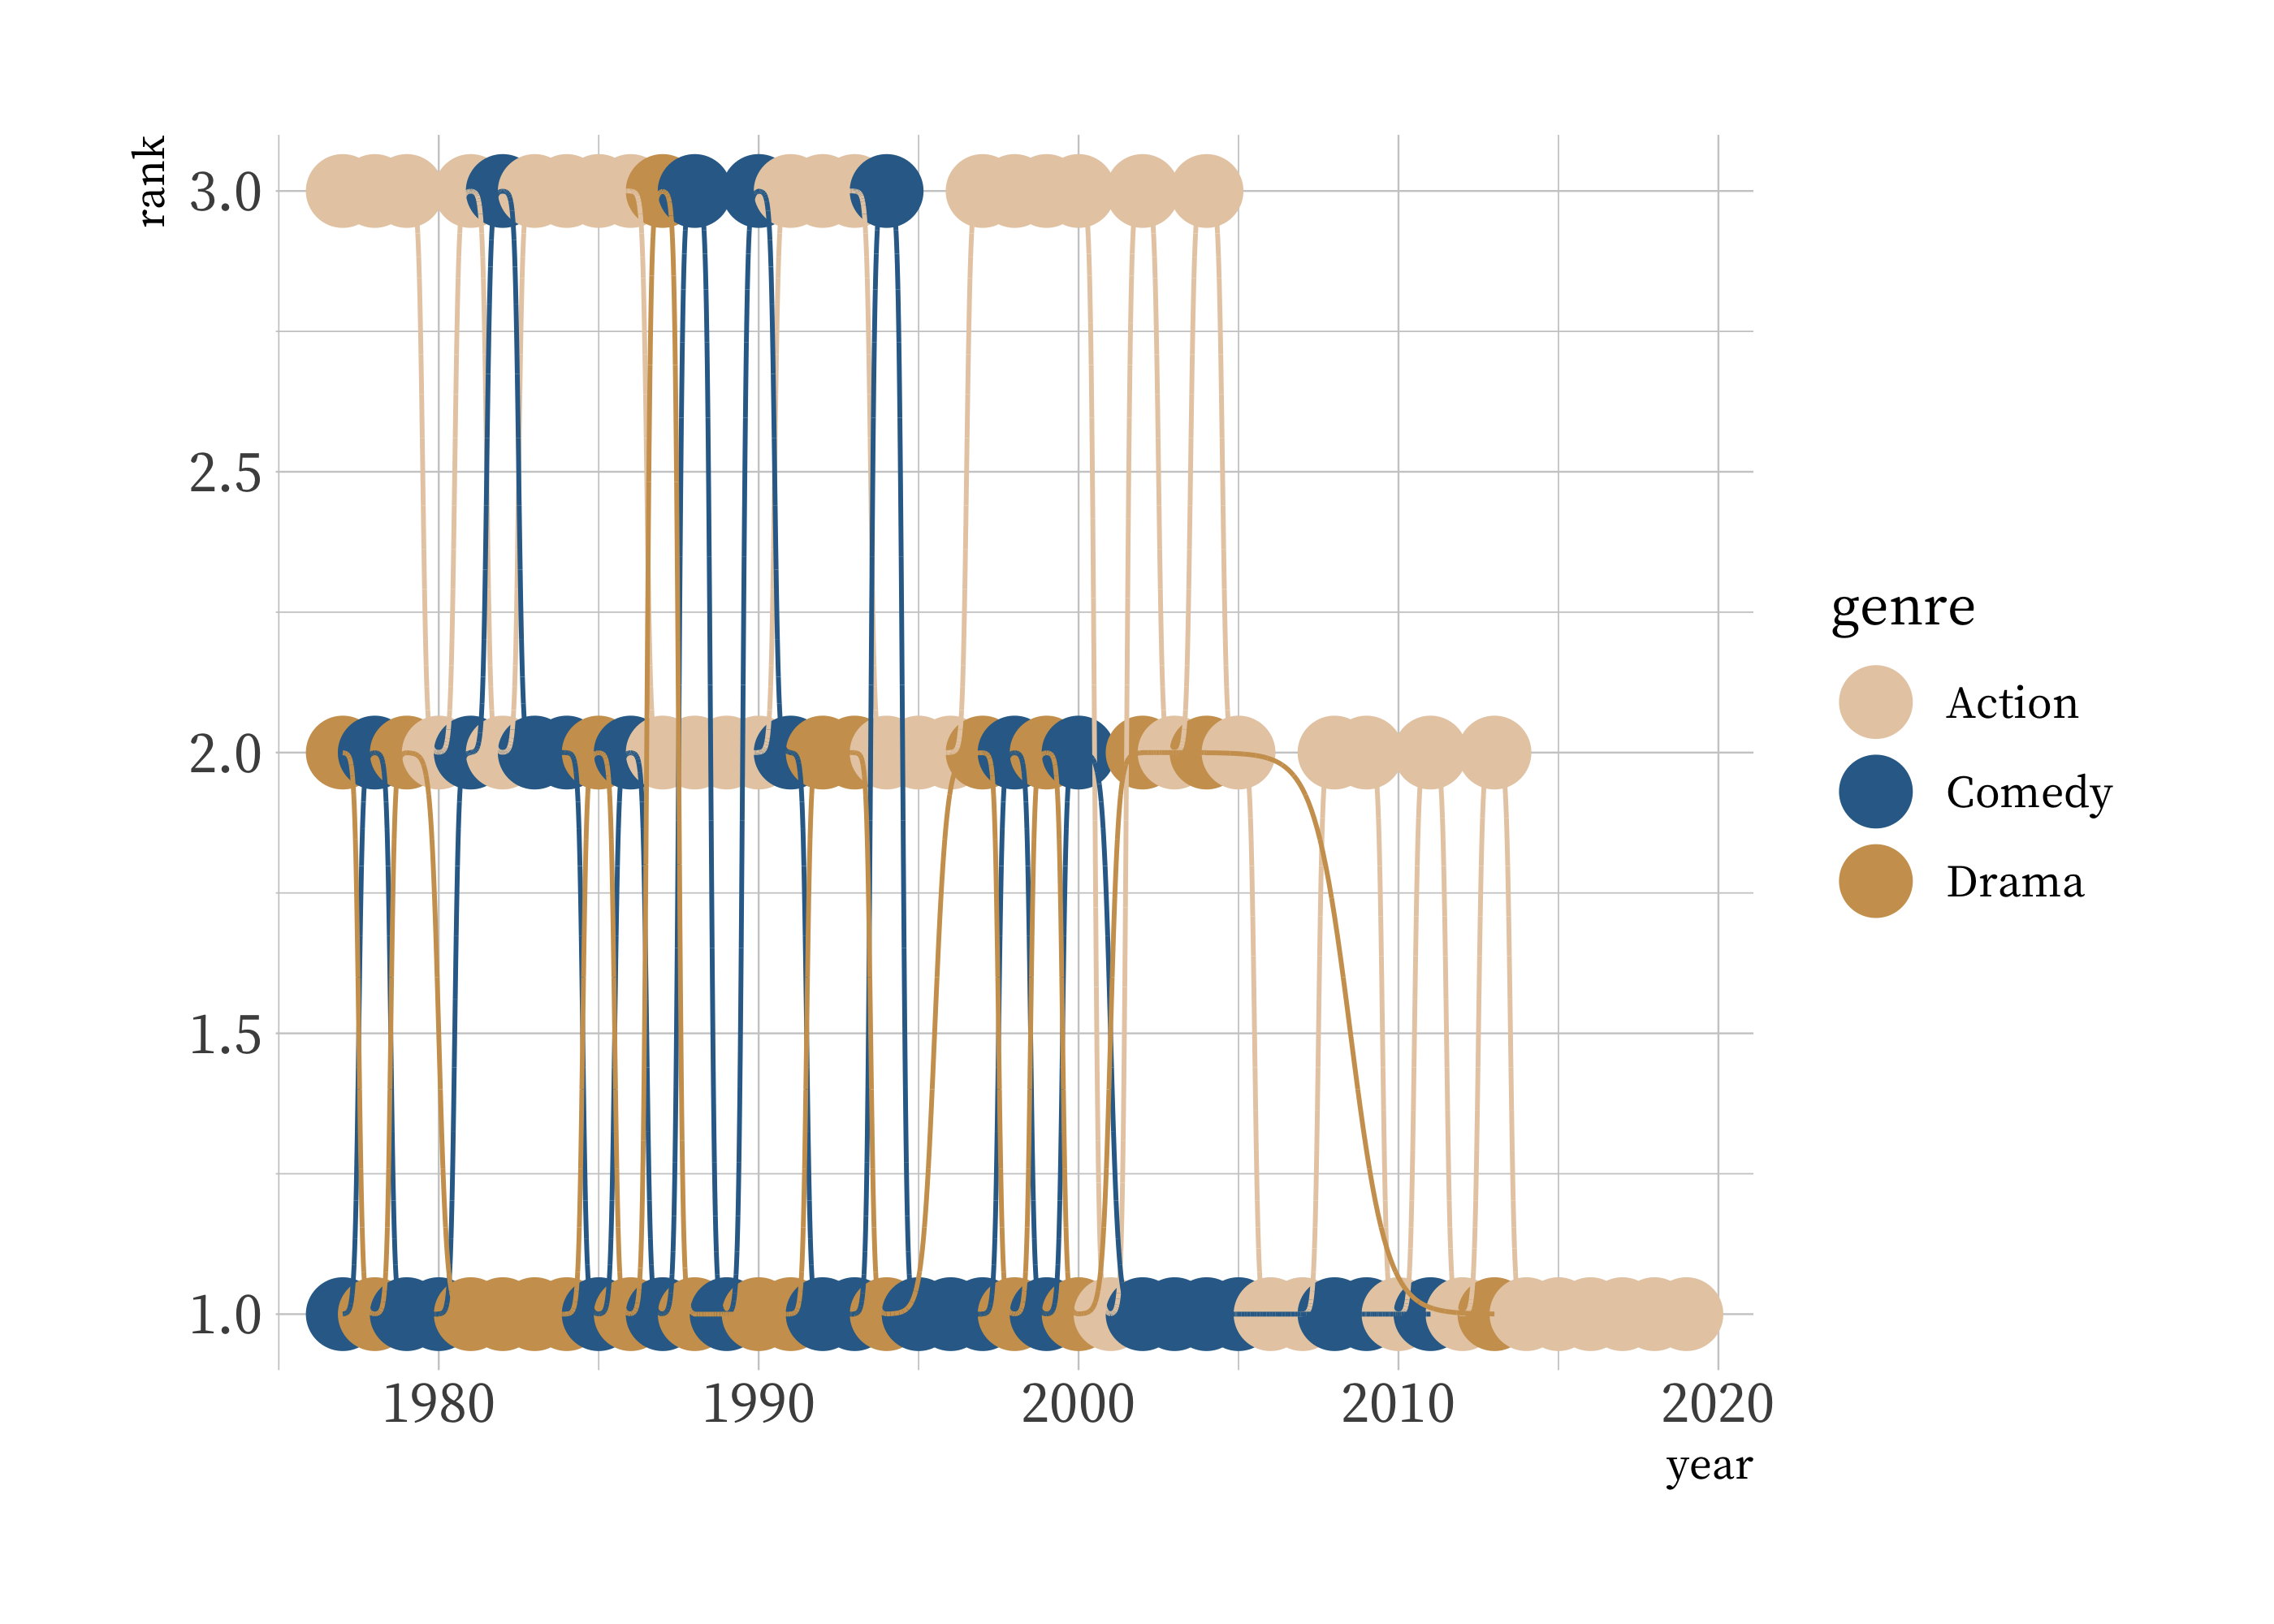
凹凸图:geom_bump()
可以用于展示排名的变化。
library(ggbump)
blockbusters %>%
dplyr::filter(genre %in% c("Action", "Comedy", "Drama")) %>%
group_by(year) %>%
mutate(rank = rank(box_office)) -> blockbusters2
ggplot(blockbusters2, aes(year, rank, color = genre)) +
geom_point(size = 7) +
geom_bump() +
scale_color_manual(values = wes_palette("Darjeeling2"))
|
| 凹凸图:geom_bump() |
 |
华夫图:geom_waffle
library(waffle)
ggplot(as_tibble(Titanic), aes(fill = Sex, values = n)) +
geom_waffle(n_rows = 20, color = "white") +
facet_wrap(~ Survived, ncol = 1) +
scale_fill_manual(values = wes_palette("Darjeeling2"))
|
| 华夫图:geom_waffle |
 |
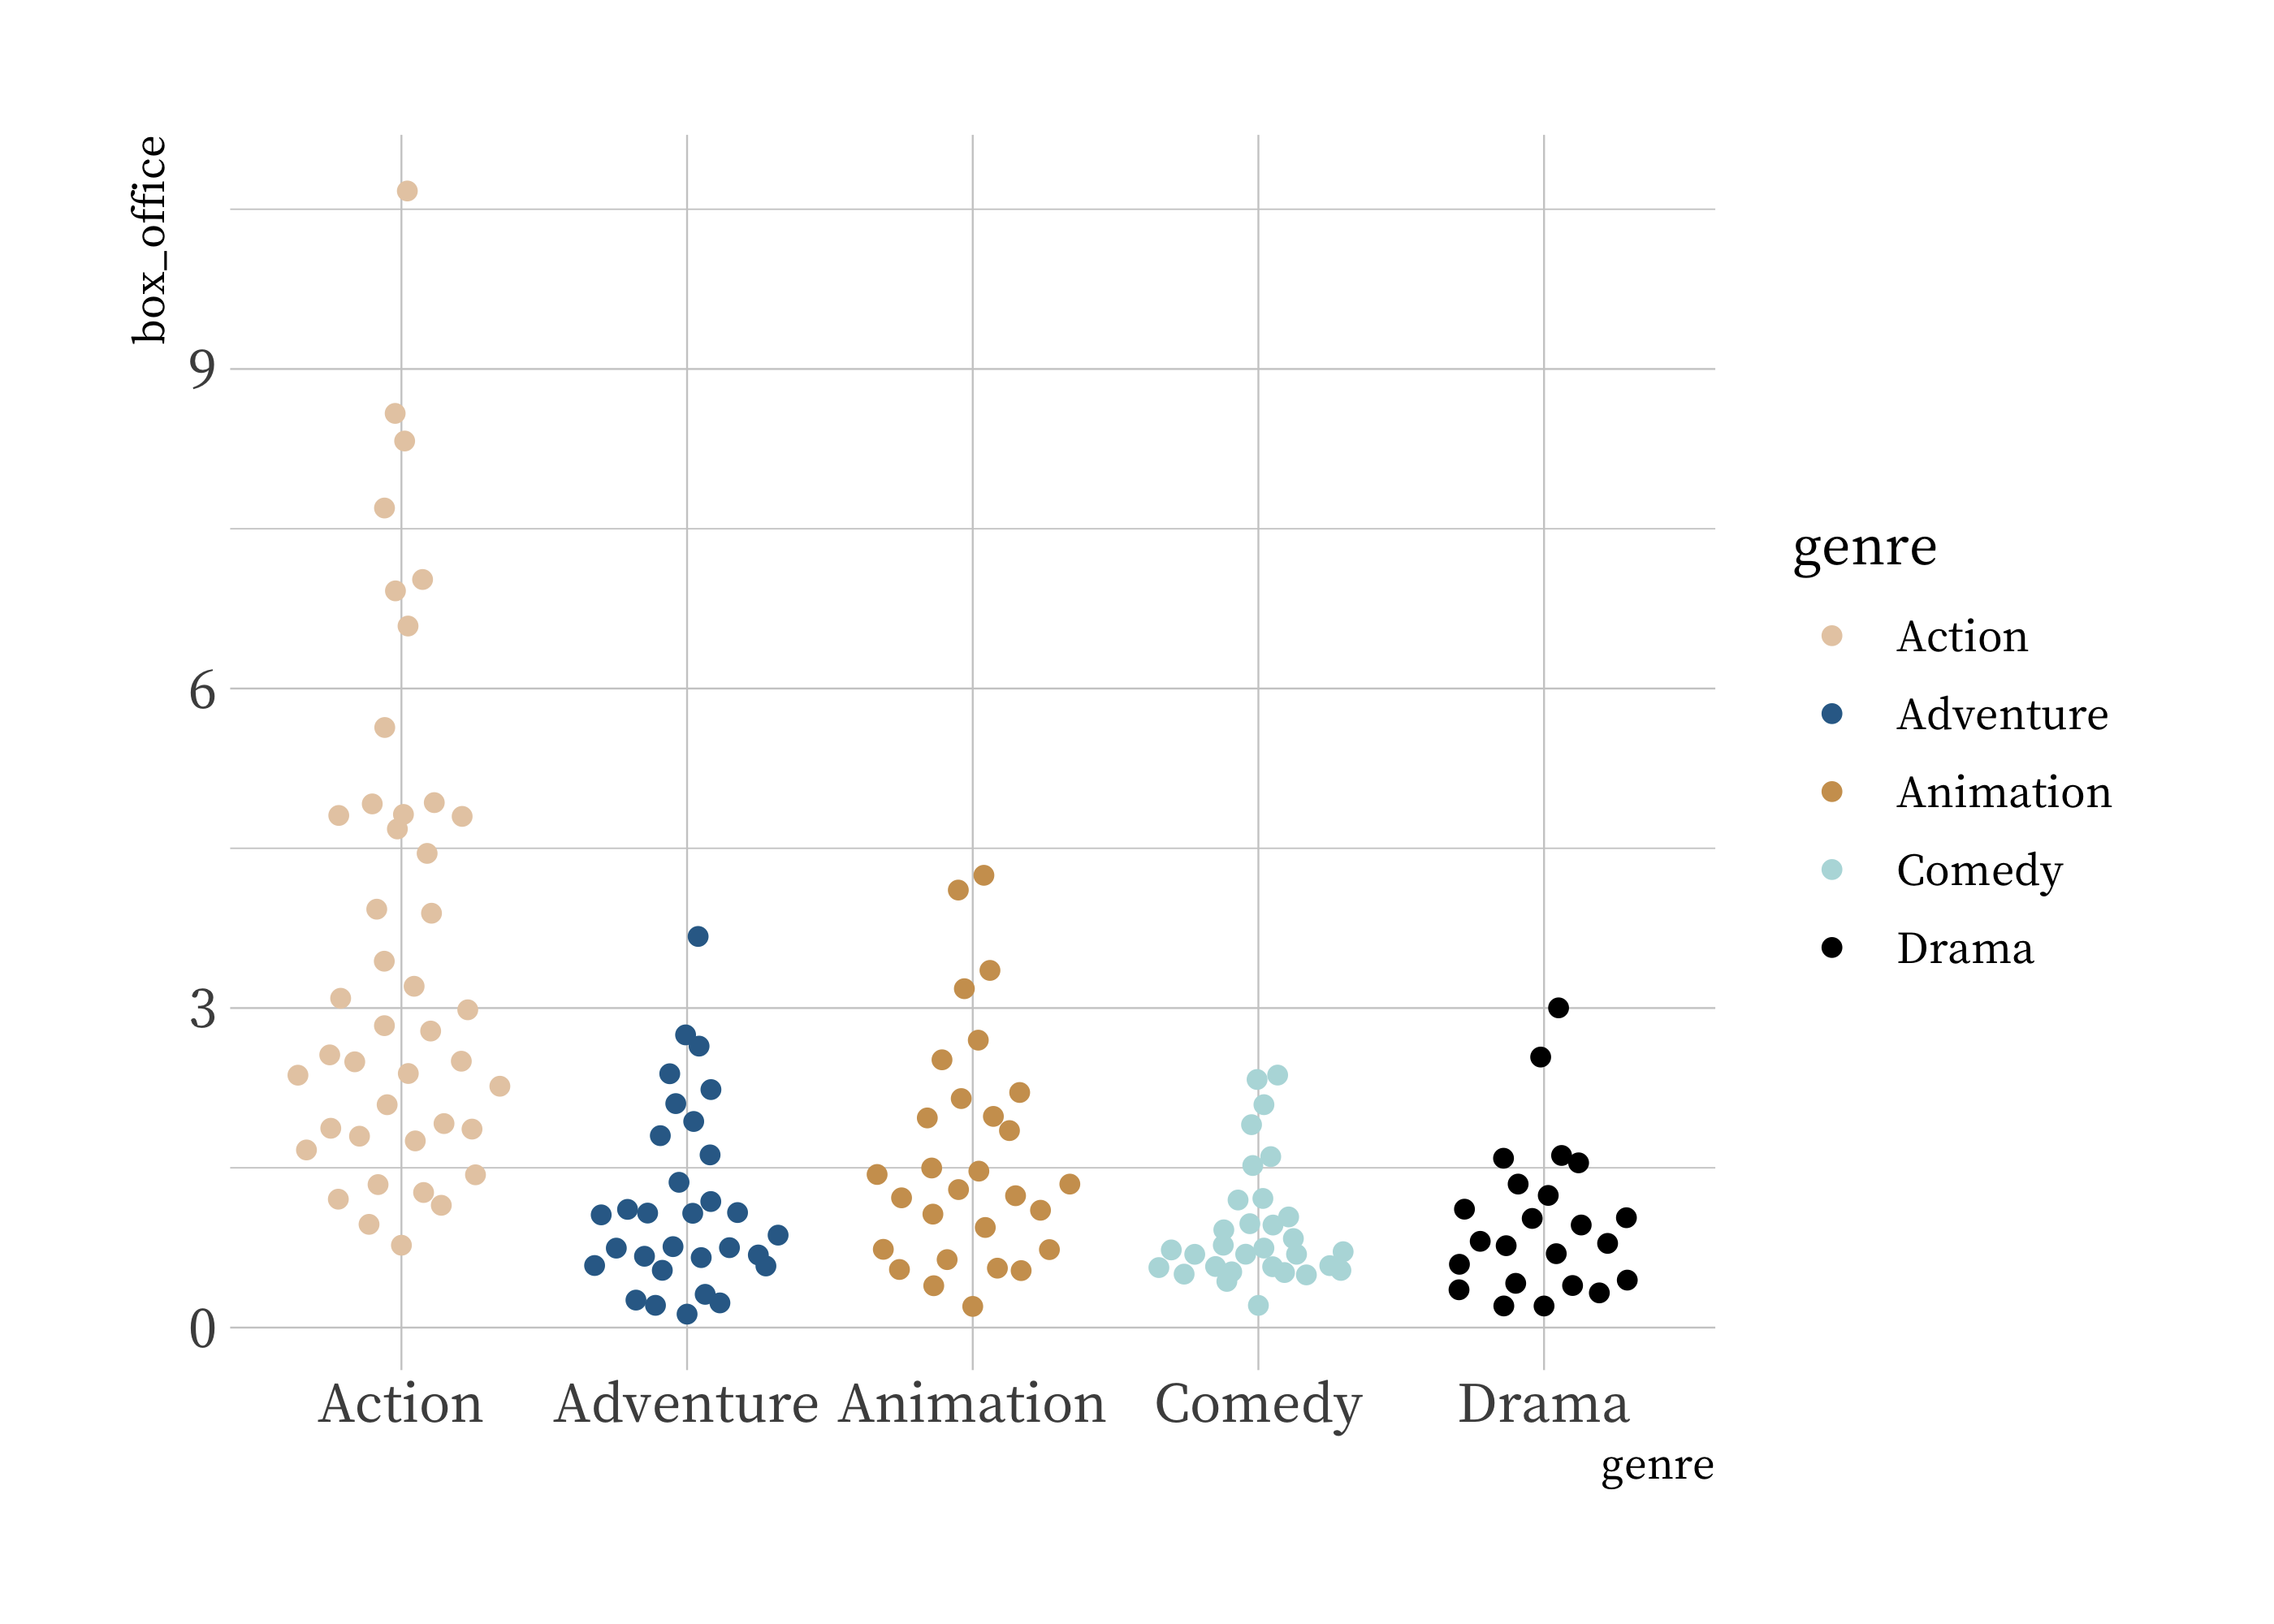
蜂巢图:geom_quasirandom()
library(ggbeeswarm)
ggplot(blockbusters, aes(x = genre, y = box_office, color = genre)) +
geom_quasirandom() +
scale_color_manual(values = wes_palette("Darjeeling2"))
|
| 蜂巢图:geom_quasirandom() |
 |
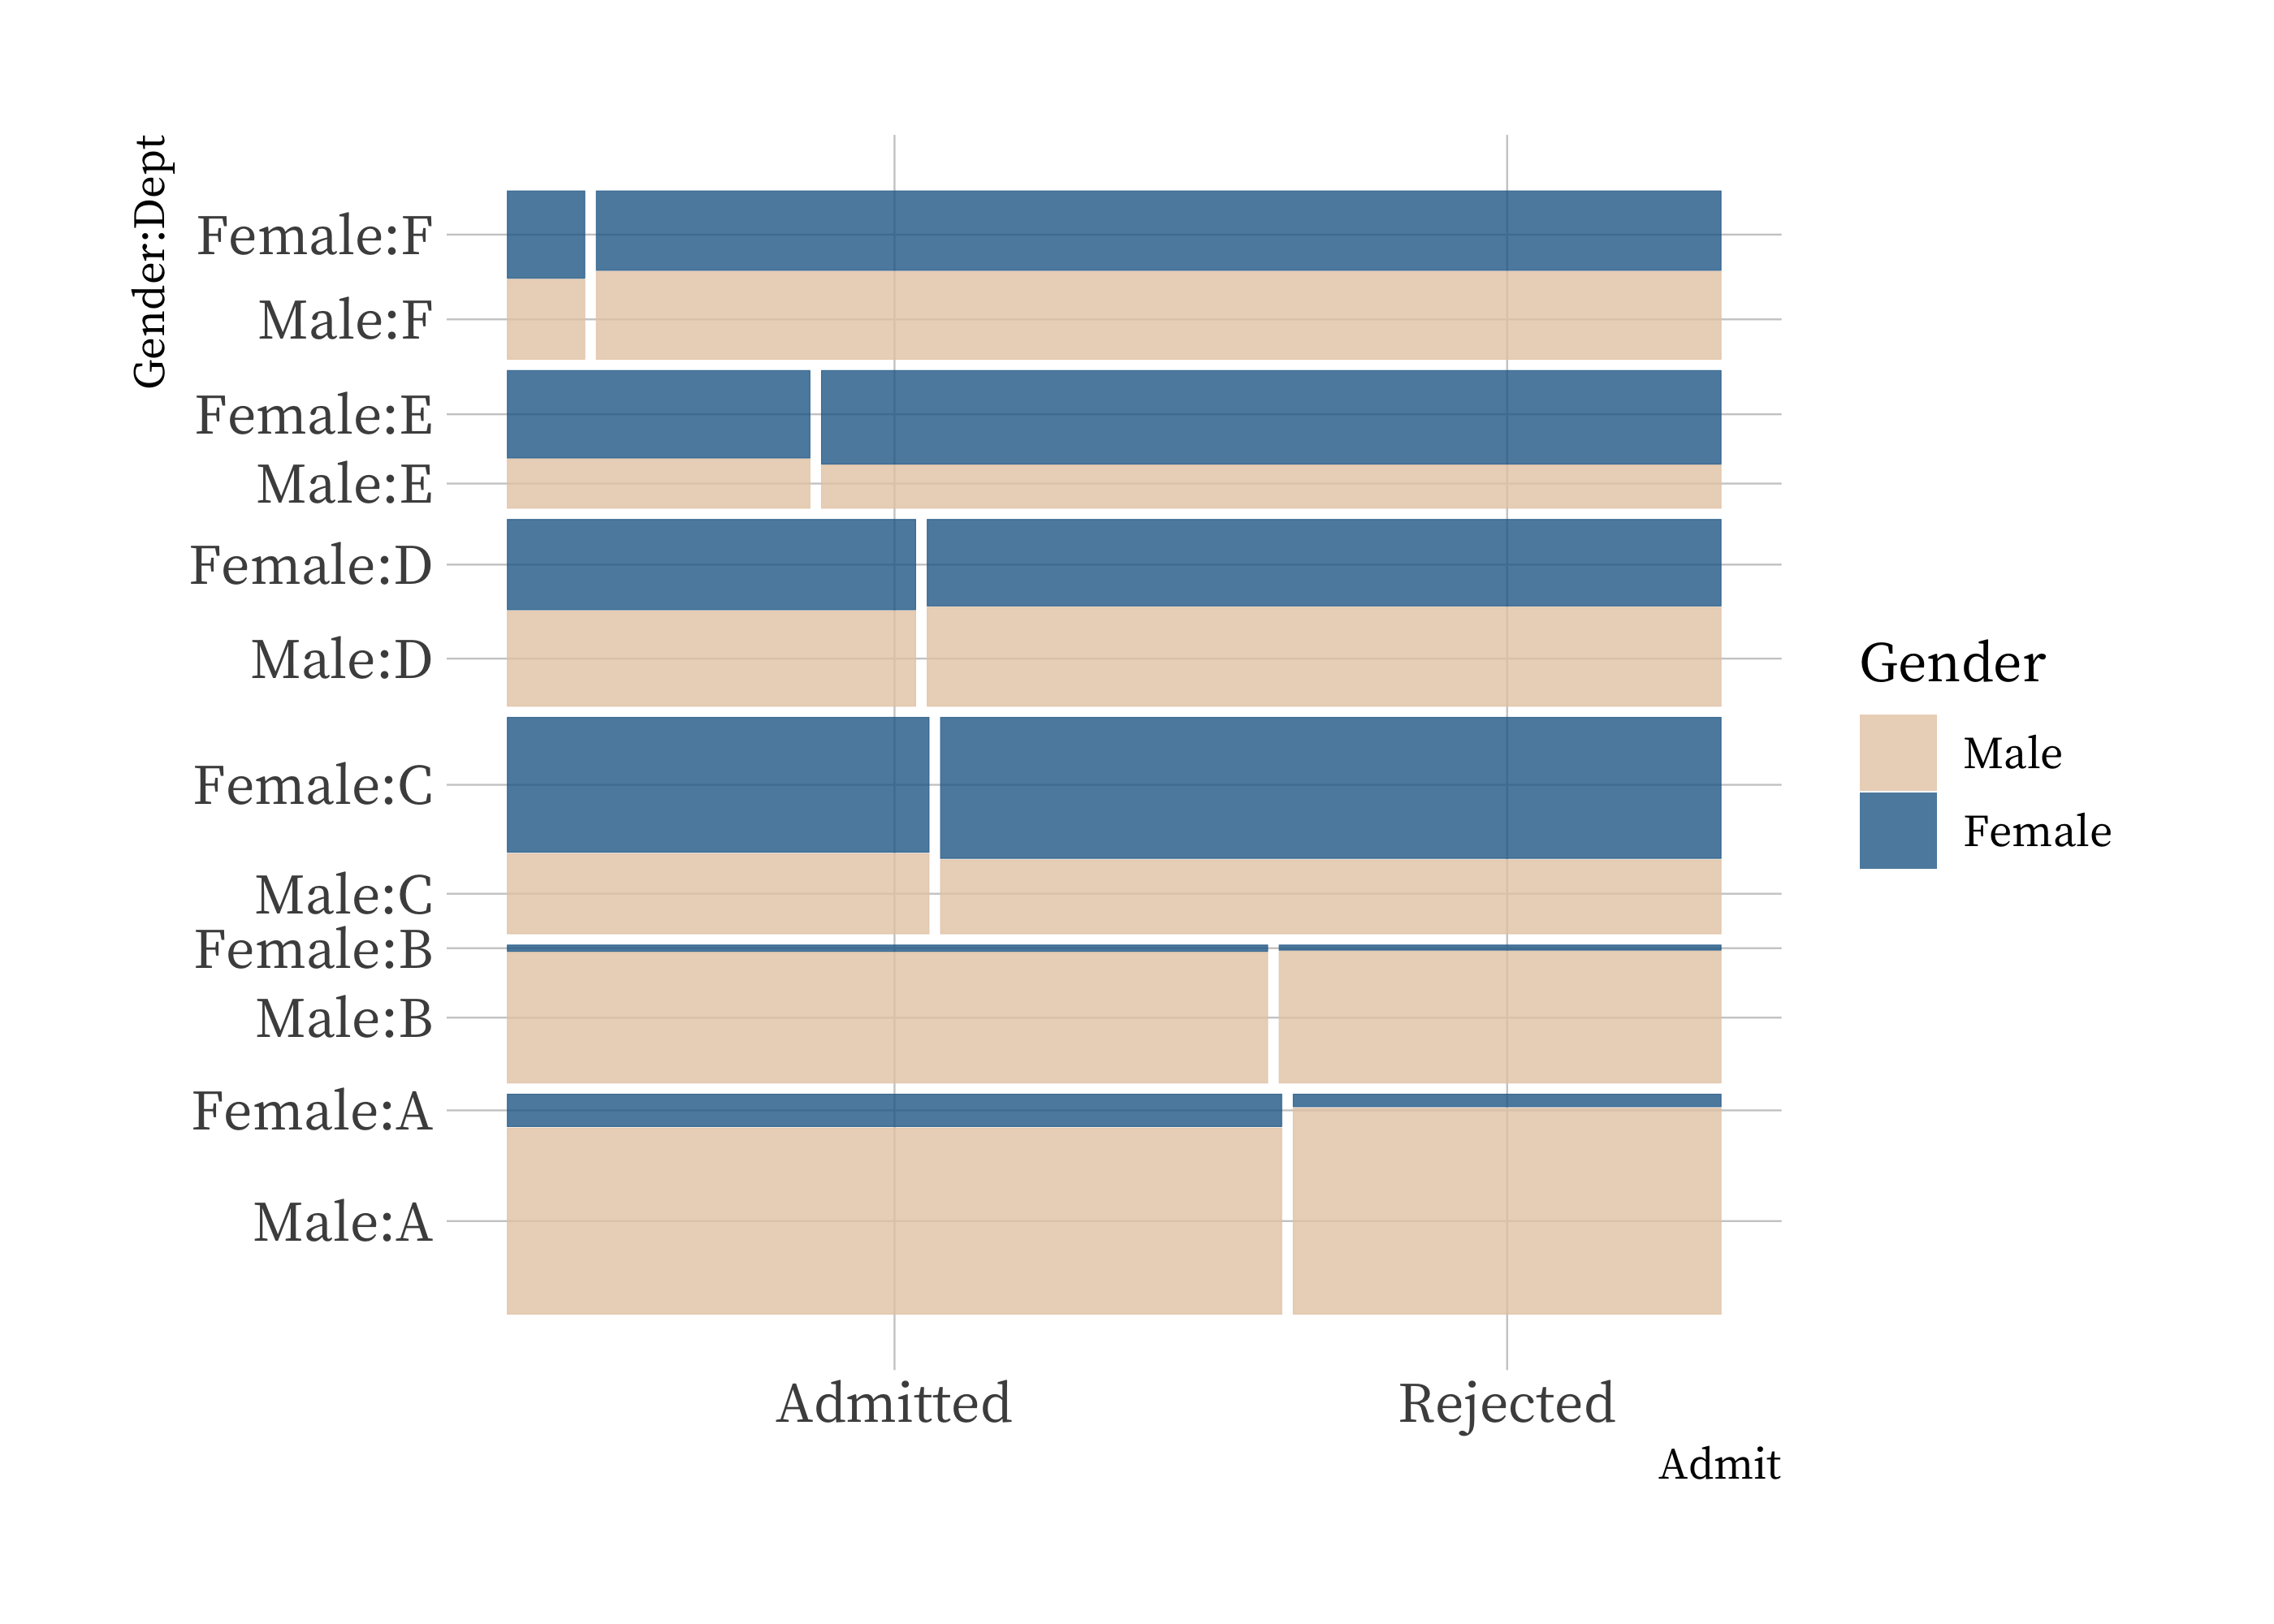
镶嵌图
library(ggmosaic)
ggplot(as.data.frame(UCBAdmissions)) +
geom_mosaic(aes(x = product(Admit, Dept), fill = Gender, weight = Freq)) +
scale_fill_manual(values = wes_palette("Darjeeling2")) +
coord_flip()
|
| 镶嵌图 |
 |
点击这里跳转到 RStata 短书平台获取附件:探索其它的 ggplot2 图层
评论