昨天一个小伙伴问了这样一个问题:
Stata 如何合并多幅图表?合并的图表如何共用一个图例?
下面我们使用 Stata 自带的 auto.dta 数据来演示一下:
首先导入数据:
然后我们绘制四幅图,并且该给每幅图分别命名为 a、b、c、d(使用 name() 选项):
* 图一
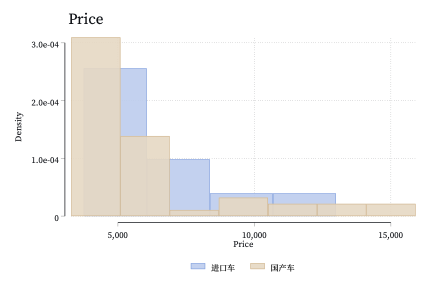
tw hist price if for, color("112 154 225%90") || ///
	hist price if !for, color("210 175 129%90") ///
	leg(order(1 "进口车" 2 "国产车") pos(6) row(1)) ///
	ti("Price") name(a, replace)
|
| 图 1 |
 |
* 图二
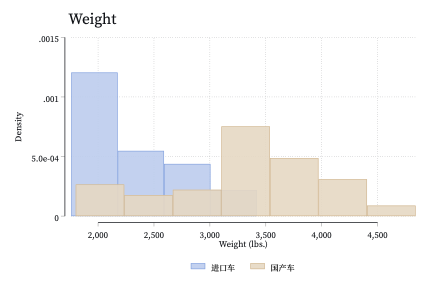
tw hist weight if for, color("112 154 225%90") || ///
	hist weight if !for, color("210 175 129%90") ///
	leg(order(1 "进口车" 2 "国产车") pos(6) row(1)) ///
	ti("Weight") name(b, replace)
|
| 图 2 |
 |
* 图三
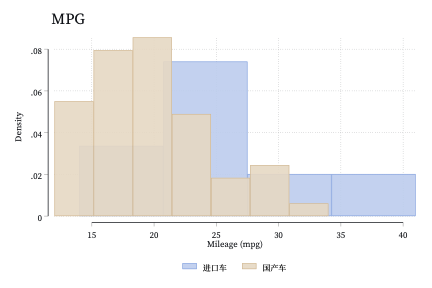
tw hist mpg if for, color("112 154 225%90") || ///
	hist mpg if !for, color("210 175 129%90") ///
	leg(order(1 "进口车" 2 "国产车") pos(6) row(1)) ///
	ti("MPG") name(c, replace)
|
| 图 3 |
 |
* 图四
tw hist trunk if for, color("112 154 225%90") || ///
	hist trunk if !for, color("210 175 129%90") ///
	leg(order(1 "进口车" 2 "国产车") pos(6) row(1)) ///
	ti("Trunk") name(d, replace)
|
| 图 3 |
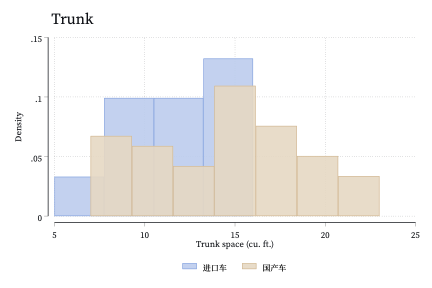 |
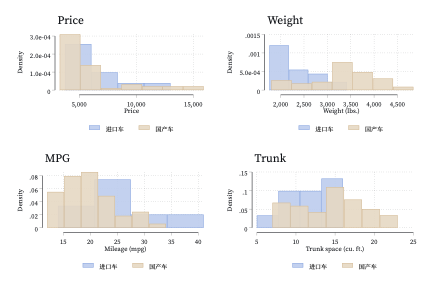
这四幅图分别展示了国产车和进口车(foreign 变量)的四个指标的分布。我们可以使用 graph combine 合并四幅图:
* 合并四幅图
gr combine a b c d, row(2)
|
| 图 4 |
 |
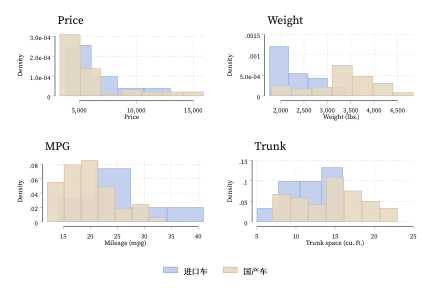
不过这样它们会各用各自的图例,使用 grc1leg 命令可以在合并图表的时候共用图例:
* 安装 grc1leg:
* net install st0357.pkg, from("http://www.stata-journal.com/software/sj14-4/") replace
grc1leg a b c d, row(2) legendfrom(a)
|
| 图 4 |
 |
点击这里跳转到 RStata 短书平台获取附件:Stata 合并多幅图表时如何共用图例?
评论